KV-PIMple: PIM-aware KV Allocator for LLM Decode
This is my hackathon submission for the Workshop on Chips and AI. My topic is KV-cache and attention inside processing-in-memory (PIM), and the result is KV-PIMple, a KV-cache allocator that knows which DRAM row its blocks land in.
This is a solo, simulation-only project. Besides the result, this writeup also covers what didn’t work and where my own model is wrong.
As for the name, KV is my initials, and it also means Key/Value. PIMple rhymes with simple, which is the point, since all I did was change the policy on top of an allocator that already exists. And it also literally means pimple, since I’m still an adolescent and still have many of those (bad joke bad joke).
Note: everything here is simulated. No GPU, no PIM hardware, no real inference. Every bandwidth number comes from a model, but dw I did document how wrong that model is.
- the code
- github.com/AndrewVu23/chip_hackathon_f26
TL;DR
- The problem: PIM attention is fast because one command can open the same row in all 16 banks of a channel and compute in all of them at once. That only works if the KV cache sits at matching rows across banks. PIM papers place the KV cache statically, so it’s aligned by construction. Real serving engines like vLLM page it instead, handing out whichever 16-token block was freed last, which scatters each sequence across DRAM rows.
- The fix: keep vLLM’s 16-token blocks, but make a sequence fill a whole region (8 consecutive block IDs = one row index across every bank and channel) before it takes another. Row-hit rate 0.77 → 0.96, effective PIM bandwidth 1,226 → 2,805 GB/s (2.3×), no extra memory.
- The validation: two cycle-level DRAM simulators agree with where my blocks land (Ramulator 2, within 0.0023 row-hit), but AttAcc says my timing is ~1.4× optimistic. So it’s 2.3× on published timing, ~1.6× on a cycle-level PIM controller.
- Found along the way:
- Row-hit rate alone said the baseline was fine (0.970). It wasn’t (#3).
- Speculative decoding broke the allocator until it got two fixes at once. Under real preemption the gain falls to 1.38×, and both fixes I tried for that failed (#9).
- The idea mostly isn’t new. PIMphony and BlockPIM get to a similar unit, and PATTON, posted in the middle of the build week, has nearly the same hierarchy (#11).
1. Background
Quick context for readers who haven’t worked with LLM serving or PIM. If you already know all three, skip to section 2. If you have no background in neural networks at all, watch 3Blue1Brown’s neural networks series first. The chapters on transformers and attention cover everything this section builds on.
KV Cache
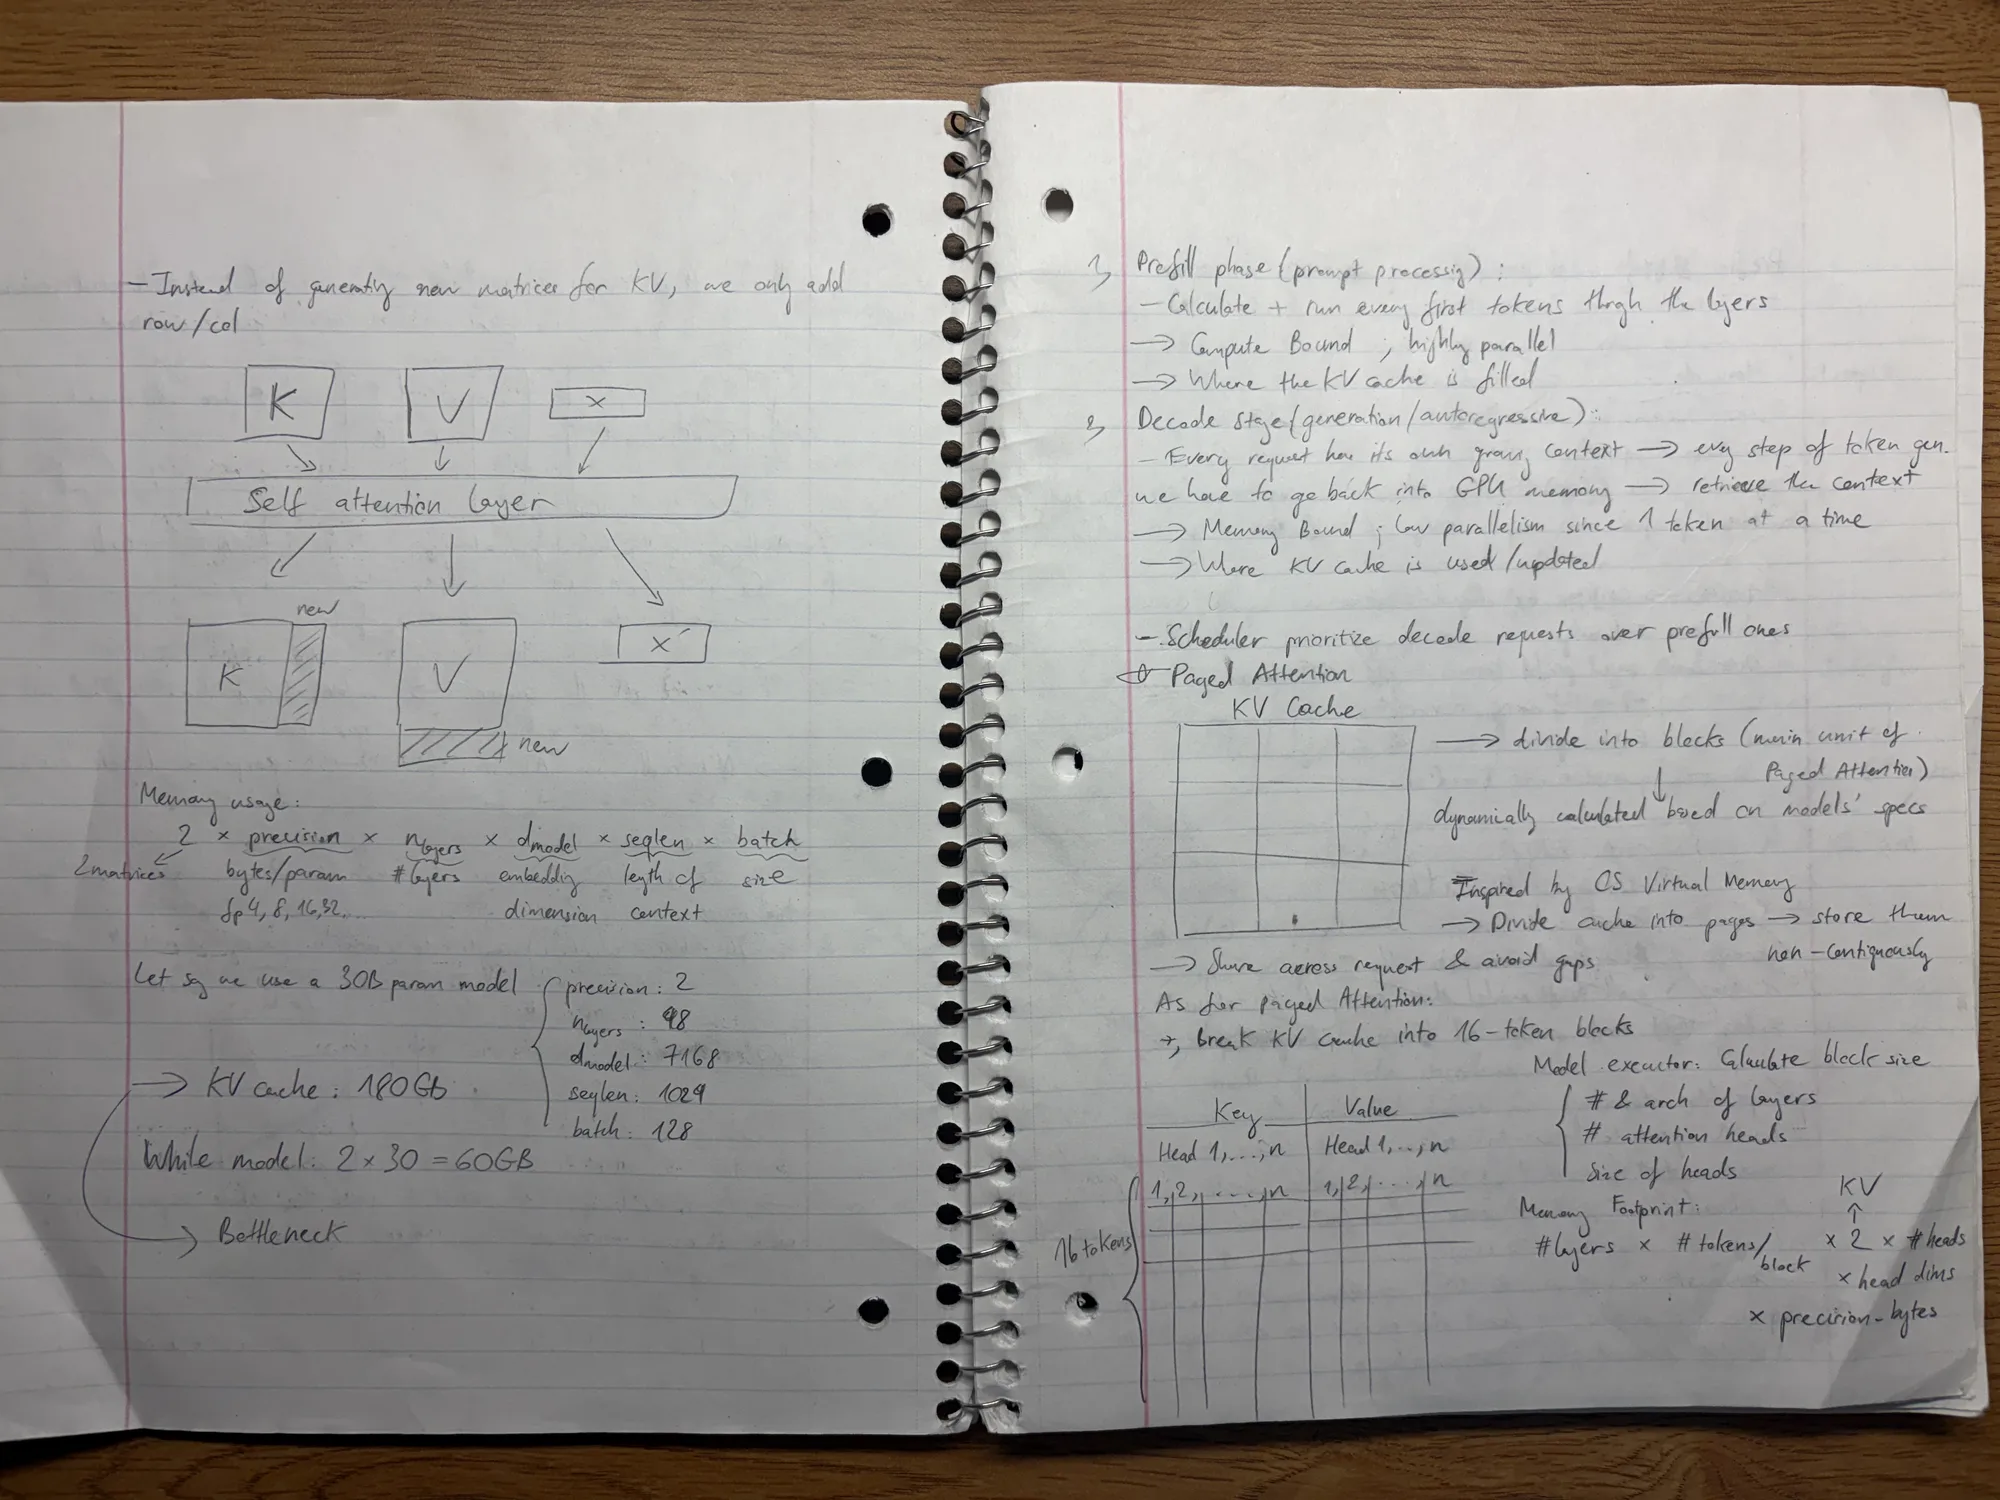
An LLM generates one token at a time. At each step, every attention layer makes a query (Q) for the new token, scores it against the keys (K) of every past token, turns the scores into weights with a softmax, and takes the weighted sum of the past values (V). The K and V of past tokens never change, so instead of recomputing them every step, you store them. That’s the KV cache, and besides the weights, it’s the biggest thing in GPU memory.
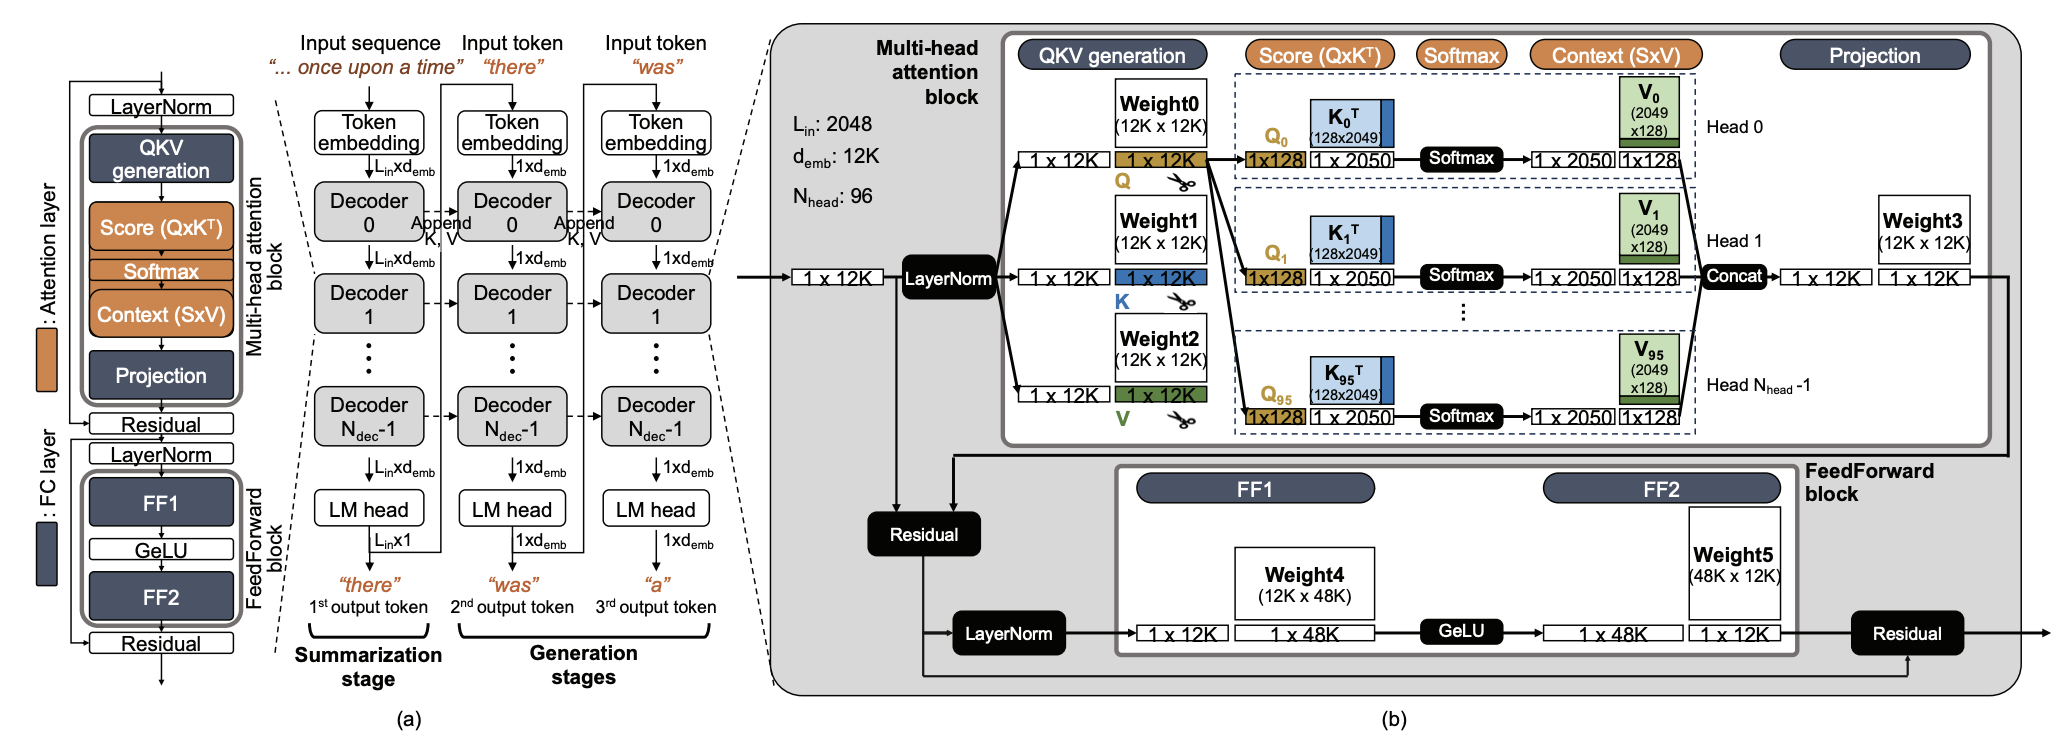
For the model shape I used (Llama-3-8B style GQA with 8 KV heads, head dim 128 and fp16), that’s 2 × 8 × 128 × 2 B = 4 KB per token per layer.
During decode, each step reads the whole cache once and does about 4 FLOPs per byte with it (with GQA). A GPU needs something like 100–300 FLOP/byte to be compute-bound. So decode attention is a memory bandwidth problem, and batching doesn’t help, because every request has its own cache.
Paging (vLLM)
The problem is that the cache grows by one token per step, and nobody knows how long the output will be. Reserve the max and most of it is wasted, and free memory turns into swiss cheese. PagedAttention (vLLM) [2] fixed this by borrowing a concept in OS: virtual memory. They cut the cache into fixed-size blocks (16 tokens by default), give each sequence a block table, and hand out physical blocks from a free list. Waste drops to under 4%, and prefix sharing comes for free.1
If you want to really understand PagedAttention, Hamza Elshafie’s “Paged Attention from First Principles” is one of the best explanations out there, if not the best. For vLLM in general (scheduler, engine, the whole thing), read the official vLLM blog’s “Anatomy of vLLM”.
The part that matters for this project is that the free list in vLLM v0.2.7’s BlockAllocator [3] is LIFO. It pops whatever block was freed last, with no idea where that block physically lives. On a GPU it doesn’t need to know, since the memory controller spreads every block across all its channels anyway and keeps thousands of reads in flight, so a scattered block costs about the same to read as a contiguous one.
PIM
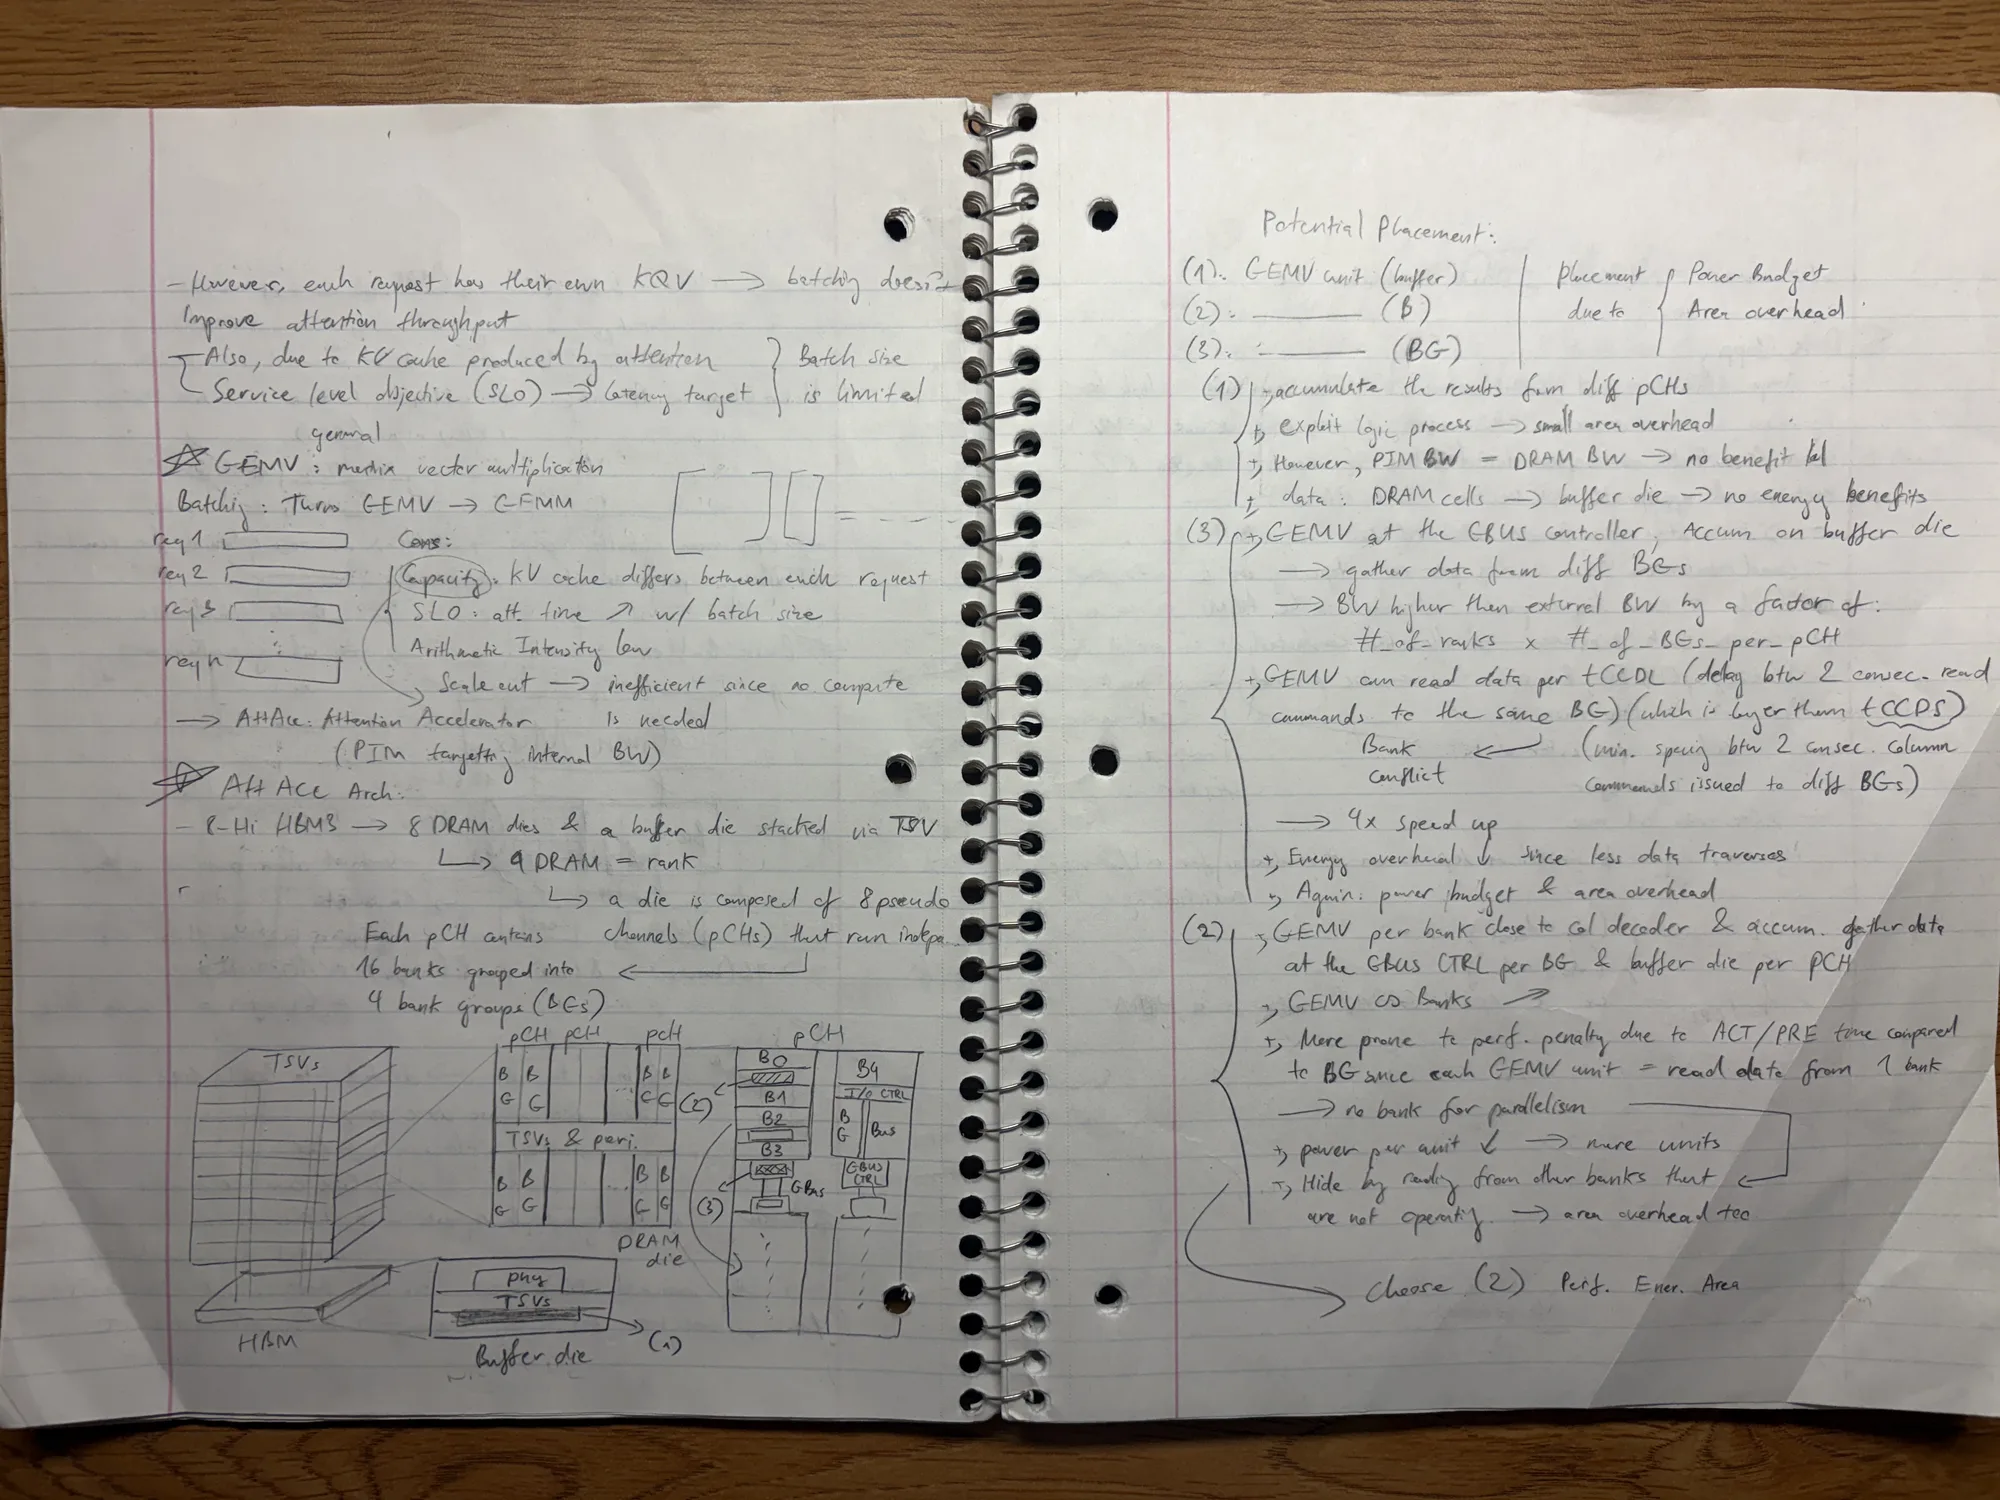
PIM puts small compute units next to the DRAM banks. Decode attention is “read a huge array and barely touch it”, so you do the touching inside the memory, where the bandwidth is much higher than what comes out of the pins. Samsung’s HBM-PIM [4] is real hardware, and AttAcc and NeuPIMs (both ASPLOS ’24) [5] are the big designs for LLM attention.
A quick DRAM refresher first (if you’ve never seen how DRAM works inside, this video is a great visual intro). A bank holds rows (1 KB each here). To read, you activate a row into the bank’s row buffer (expensive), then pull 32 B bursts out of it (cheap). Reading from the row that’s already open is a row hit. Opening a different row costs a full row cycle, or tRC.
That’s also where the pin limit comes from. A normal read leaves the chip through the channel’s data pins, and those pins carry one bank’s 32 B burst at a time. So even with 16 banks per channel, only one of them is sending data out at any moment, and the other 15 open row buffers just wait their turn. An HBM3 stack has 1,024 data pins at 6.4 Gb/s each, which caps it at about 819 GB/s no matter how many banks are inside. PIM skips the pins. If every bank has its own compute unit, all 16 banks can read from their row buffers at the same time, and only the small results have to leave the chip. In the config below, that’s 3,810 GB/s of internal bandwidth, about 4.7× what the pins allow.
The trick that makes PIM fast is the all-bank operation. Open the same row index in all 16 banks of a channel, broadcast one command, and every bank computes on its own row buffer in lockstep. One command moves 16 × 32 B = 512 B every tCCD_ab. The catch is that it only works if the data sits at the same row index in every bank. And since all 16 banks move together, if any one of them needs a new row, they all pay the row cycle.
The DRAM I modeled (it matches AttAcc’s HBM3 config):
| HBM3-PIM | value |
|---|---|
| pseudo-channels | 32 |
| banks per channel | 16 |
| row size | 1 KB (32 bursts of 32 B) |
| all-bank command (tCCD_ab) | 4.3 ns, 512 B per channel |
| row cycle (tRC) | 45 ns, ~10.5× a command2 |
| external bandwidth (pins) | ~819 GB/s |
| ideal all-bank bandwidth (inside) | 3,810 GB/s |
- If two requests start with the same words (like the same system prompt), their K and V for that part are identical too. So instead of storing it twice, they share the same blocks. Once a request needs to change one of those shared blocks, it gets its own copy first. ↩
- The 10–11× ratio is from the RH+ [6] measurement on AttAcc + Ramulator 2, which also found that host-style address interleaving forces consecutive all-bank commands into different rows. Only the ratio matters for the results here, not the absolute nanoseconds. ↩
2. Deadly Assumptions
Every PIM paper I read places the KV cache statically. The architect picks the layout once, so it’s aligned by construction. Every serving paper assumes memory is flat, so where a block lands doesn’t matter. I couldn’t find anyone who measured what happens when a real paging allocator (16-token blocks, LIFO free list, requests arriving and leaving all the time) feeds a PIM unit.
I didn’t run vLLM for this. Installing it on my Mac would’ve eaten days, and I don’t need inference anyway, only where the blocks go. And since placement is decided entirely by the block manager, I ported vLLM v0.2.7’s BlockAllocator into Python and cited it down to the file, commit and line. Then a small simulator around it:
workload.py   steady | longctx | prefix | spec, Poisson arrivals, seeded
   v
   |
sim.py        continuous-batching decode loop: admission, block growth,
   |          release, optional vLLM preempt-by-recompute
   v
allocator.py  paged (vLLM port) | KV-PIMple | contiguous | random
   |
   v
addrmap.py    KV address -> (channel, bank group, bank, row, column)
   |
   v
pimmodel.py   group bursts into all-bank commands -> M1, M2, M3
The default run uses 1,000 requests with ShareGPT-like lengths (median ~200 tokens in and out), batches of up to 64, one representative layer, and a 64-burst reorder window in the controller. No GPU. Each run takes under a minute on a laptop, which is what makes the sweeps below possible.
Three metrics, fixed before the first run:
- M1, row-hit rate: the fraction of all-bank commands whose row is already open in every participating bank. A partial hit is a miss.
- M2, bank participation: banks used per command ÷ 16.
- M3, effective bandwidth: hits cost one command interval, misses cost a full row cycle:
M3 = BWideal × M2 × tCCD_abM1 · tCCD_ab + (1 − M1) · tRC
Breaking it down:
- BWideal is the best case. Every channel issues one all-bank command every tCCD_ab (4.3 ns), and each command moves 16 banks × 32 B = 512 B. Across 32 channels that’s 32 × 512 B ÷ 4.3 ns = 3,810 GB/s.
- × M2 scales for idle banks. A command that only uses 8 of 16 banks moves half the data in the same time, so bandwidth drops by the same fraction.
- The fraction scales for misses. A hit takes tCCD_ab (4.3 ns), and a miss takes a full row cycle, tRC (45 ns). With a fraction M1 of hits, the average command takes M1 · tCCD_ab + (1 − M1) · tRC. The ideal is tCCD_ab, so ideal ÷ average is how close to full speed you run.
Since one miss costs as much as ~10 hits, a few misses go a long way. At KV-PIMple’s M1 = 0.963, the average command takes 0.963 × 4.3 + 0.037 × 45 ≈ 5.8 ns, so it runs at 74% of ideal, and with M2 ≈ 0.99 that’s ~2,800 GB/s. At paged’s 0.77, the 23% misses make the average command more than 3× slower than ideal. The formula also assumes a miss can’t overlap with anything else, which turns out to be the main thing it gets wrong (section 8).
3. Kill Test
Before building anything, I set a stop rule and measured the paged baseline first. If its row-hit rate came back under ~0.3, the problem is real. If it came back over ~0.7, stop and say so, with no hunting for a workload that makes it look bad, so no cherry-picking here.
On Aug 28 it came back at 0.970. The rule fired.
Then I looked at the other two metrics:
| address map (paged, 16-token blocks) | row-hit (M1) | banks (M2) | bandwidth (M3) | % ideal |
|---|---|---|---|---|
| host-centric (textbook) | 0.970 | 0.124 | 368 GB/s | 9.7% |
| host-cacheline (realistic) | 0.759 | 0.990 | 1,173 GB/s | 31% |
| pim-friendly (slab per channel) | 0.969 | 1.000 | 2,938 GB/s | 77% |
The textbook host-centric map puts the column bits lowest, so a stream of addresses sweeps a whole row of one bank before moving on to the next bank. Rows stay open, so row-hit looks great. But only about 2 of 16 banks are busy per command, and the bandwidth is 9.7% of ideal. The 0.970 was real, it just measured the wrong thing. If I had trusted row-hit alone, I would’ve either killed the project, or worse, called the baseline fine.
On the realistic map, which interleaves cache lines across channels and banks like a real host does, the actual gap shows up, with row-hit at 0.759 and 1,173 GB/s. The pim-friendly map gives each channel its own slab, so a 16-token block covers 4 whole rows in one channel and scattering doesn’t matter at all. Real hosts don’t lay memory out like that though.
So the problem is narrower than I first framed it, but it’s there. From here on, every config is judged on all three metrics, never on M1 alone, and everything uses the realistic host-cacheline map.
4. Row Index
This is the core of the project, and it fits in one line.
The KV pool is one big tensor indexed by block ID. Under the host-cacheline map, the memory controller spreads consecutive bytes across all 32 channels and all 16 banks, and only moves to the next row index after it has filled one row in every bank of every channel: 1 KB × 16 × 32 = 512 KB. A block is 16 tokens × 4 KB = 64 KB. So 8 consecutive blocks share one row index:
row = ⌊block ID / 8⌋
Picking a block number is picking a row. vLLM’s free list picks numbers with no idea about that.
Here’s where the ÷ 8 comes from. The host-cacheline map slices a byte address into DRAM fields like this (bit ranges, high to low):
bits:   32 ... 19 | 18 .. 15 | 14 13 | 12 11 | 10 .. 6 |   5    | 4 .. 0
field:     row    |  col hi  |  bg   |  ba   | channel | col lo |  byte
        (16K rows)            (bank = bg:ba, 16/ch)  (32)  (64 B line) (32 B burst)
Read it from the right. The lowest 5 bits pick a byte inside one 32 B burst. The column (which burst inside a bank’s 1 KB row) is split in two.3 col lo is 1 bit, so a 64 B cache line stays together in one bank. Then come the channel and bank bits, so consecutive cache lines get dealt out to all 32 channels and all 16 banks. Only after that does col hi move on to the next cache line inside the same rows. When col hi wraps around, every bank’s 1 KB row is full and the row number goes up by one. That’s 32 × 16 × 1 KB = 512 KB per row, so row = address ÷ 512 KB. Block N starts at address N × 64 KB, which makes row = N ÷ 8. For comparison, the other two maps from section 3:
host-centric:   row | bg | ba | channel | col | byte   (col lowest: M2 collapses)
pim-friendly:   channel | row | col | bg | ba | byte   (channel on top: one slab each)
That also explains the 0.75. A 64 KB block spread over 32 channels is 2 KB per channel, which is 4 all-bank commands of 512 B. If each block of a sequence sits in a different row from the one before it, every block pays one activation per channel. That’s 1 miss in every 4 commands, so ~0.75. If a sequence’s blocks fill rows in order instead, you miss once per row. A row is 1 KB per bank = 32 bursts = 32 commands, so 1 miss in 32 gives 31/32 = 0.969. That’s the ceiling, and no allocator can beat it.
LIFO isn’t random tho. A fresh pool hands out consecutive IDs, so the first few sequences look fine. The scatter comes from churn. Requests finish and return blocks in whatever order, and the next sequence gets a mix. This doesn’t even need a DRAM model to see. Under churn, only 3–7% of a sequence’s consecutive blocks are physically next to each other, and a sequence is spread over 5–16× more regions than it needs. The code calls that last number frame_spread (regions touched ÷ regions needed, 1.00 is perfect).
- Here a “column” means one 32 B burst, not a datasheet column. A real HBM3 pseudo-channel is 32 bits wide, so a datasheet column is 4 B and a 1 KB row has 256 of them. But every read is a burst of 8 columns, so the controller only ever picks which burst, and the 3 bits that pick a word inside it are folded into the “byte” field. Simulators like Ramulator count columns the same way, and papers switch between the two meanings without saying so. Careful, I’ve been there. Some papers made no sense to me until I figured out which “column” they meant. ↩
5. Regions
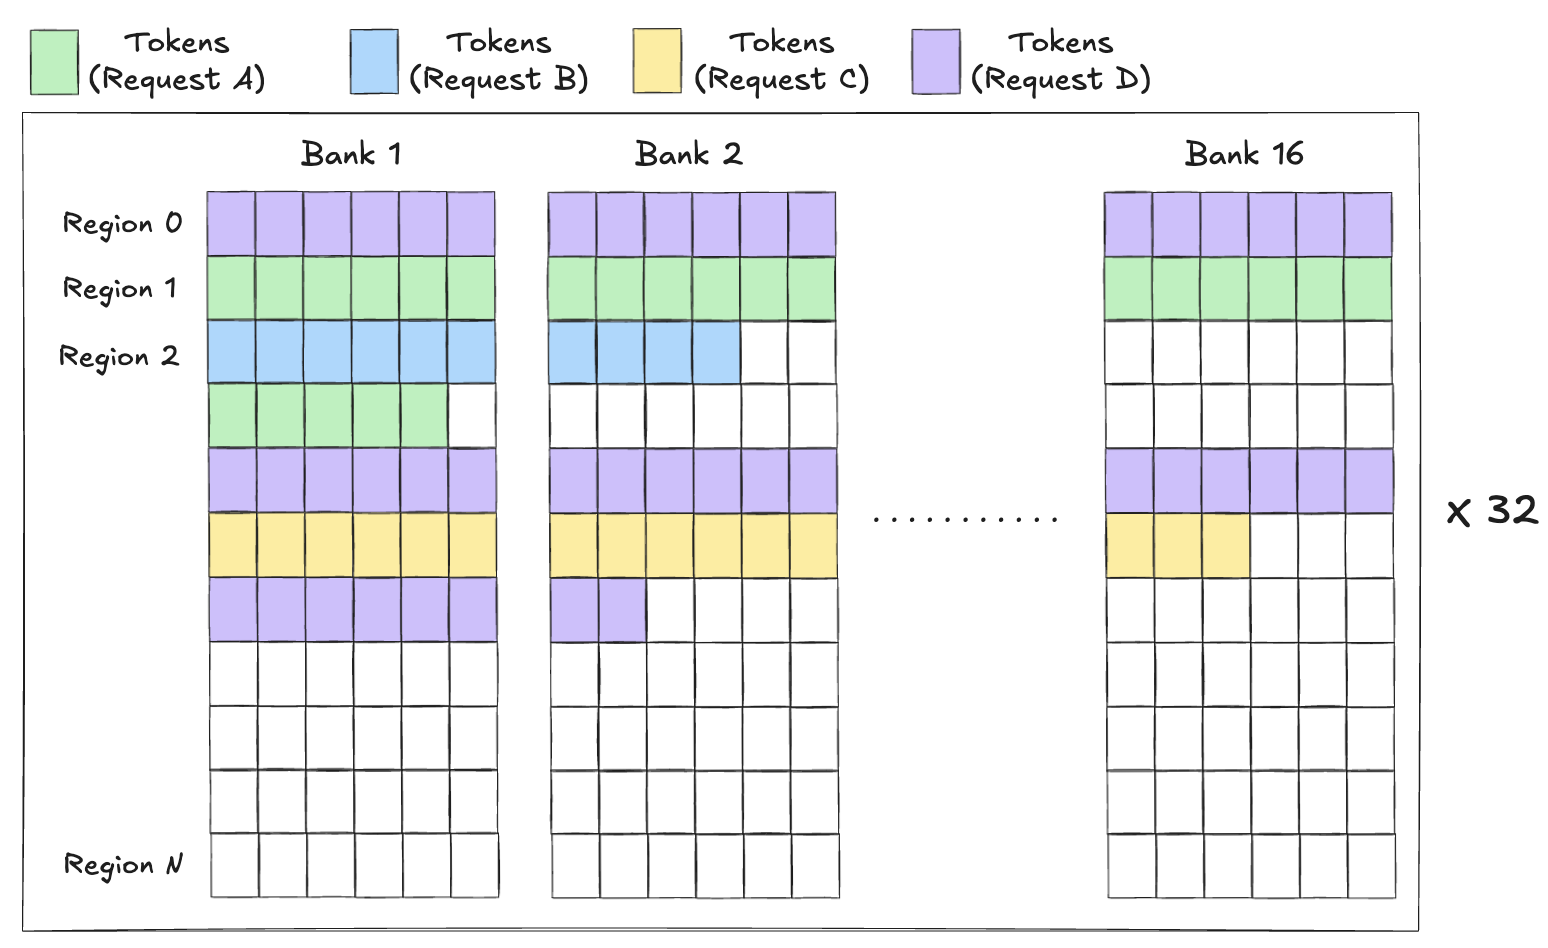
KV-PIMple keeps vLLM’s 16-token blocks and changes how block IDs get picked:
- Split the pool into regions. A region is the set of blocks that fills one row index across every bank and every channel (8 blocks here).
- A sequence fills its current region at ascending offsets before claiming another one. A new region is the lowest empty one.
- Freed blocks go back to their own region, so alignment survives reuse.
- If no region is empty, fall back to the partial region with the most free slots. That’s just plain paging, so it degrades instead of failing.
The region size isn’t tuned. It comes straight from the hardware and the model:
region_size       = row x banks x channels       = 1 KB x 16 x 32       = 512 KB
token_size        = 2 (K, V) x kv_heads x head_dim x bytes = 2 x 8 x 128 x 2 = 4 KB
tokens_per_region = 512 KB / 4 KB    = 128 tokens
blocks_per_region = 128 / 16 tokens  = 8 blocks
config.derive_block_tokens() computes this at startup. Change the model or the DRAM and it follows. An MQA model at 512 B/token gets 64 blocks per region, and an MHA model at 16 KB/token gets 2.
That’s the whole fix. The allocator never touches an address, the hardware doesn’t change, and the PIM command set also doesn’t change.
The other lever is to make the block 128 tokens, so one block is one region. That’s roughly what prior PIM work does, and it gets the same row-hit rate. But it gives up the fine-grained packing that paging exists for in the first place.
6. Implementation
Allocator. Here’s the vLLM baseline, the whole policy, ported from v0.2.7’s vllm/core/block_manager.py:
class PagedFirstFit(KVAllocator):
    def __init__(self, num_blocks):
        self.free_blocks = list(range(num_blocks))   # ascending ids

    def _alloc_one(self, seq_id):
        return self.free_blocks.pop()                # LIFO: last freed comes out first

    def _free_one(self, block):
        self.free_blocks.append(block)
And KV-PIMple, trimmed (the code calls regions frames, and G is blocks per region, 8 here):
# one min-heap of free slots per region, one min-heap of empty regions
self.frame_free   = [list(range(G)) for _ in range(n_frames)]
self.empty_frames = list(range(n_frames))
self.affinity     = {}                               # sequence -> its current region

def _alloc_one(self, seq_id):
    f = self._pick_frame(seq_id)
    off = heapq.heappop(self.frame_free[f])          # lowest free slot in that region
    return f * G + off                               # block ID, so row = f

def _free_one(self, block):
    f, off = divmod(block, G)                        # the block goes back to its own region
    heapq.heappush(self.frame_free[f], off)
    if len(self.frame_free[f]) == G:                 # region is whole again
        heapq.heappush(self.empty_frames, f)

def _pick_frame(self, seq_id):
    f = self.affinity.get(seq_id)
    if f is not None and self.frame_free[f]:         # 1. keep filling my region
        return f
    while self.empty_frames:                         # 2. lowest empty region
        f = heapq.heappop(self.empty_frames)
        if len(self.frame_free[f]) == G:             # skip stale heap entries
            self.affinity[seq_id] = f
            return f
    f = max(range(n_frames), key=lambda f: len(self.frame_free[f]))
    self.affinity[seq_id] = f                        # 3. fallback: emptiest partial region
    return f
I left out the pool-exhausted check and the best-fit planning from section 9. Speculative draft blocks go through the same code under one shared key ("scratch") instead of the sequence’s ID, which is how they get their own regions.
The baseline is O(1) per operation. KV-PIMple is O(log G) for the heaps, plus a scan over all regions in the fallback. Section 10 measures what that costs.
How commands get counted. pimmodel.py walks each sequence’s KV bursts per channel, in token order, and groups them into all-bank commands:
- Two bursts can share a command if they’re in the same channel, at the same row, in different banks.
- The controller can reorder within a 64-burst window (its buffer). Inside a window, bursts are grouped by row. A row group with at most m bursts in any one bank needs m commands, since same-bank bursts have to wait their turn.
- Commands for the same row issue back to back, so each row group pays at most one miss. If a group matches the row left open by the previous window, it goes first and starts with a hit.
Then M1 = hits ÷ commands and M2 = bursts ÷ (16 × commands). Two modeling choices here, and both work against my own claim:
- Columns are relaxed. A command may read a different column in each bank. Real HBM-PIM broadcasts one column to every bank. Relaxing that can only help scattered placement, so it flatters the paged baseline.
- Every sequence starts cold. Each sampled sequence starts with no open row, which costs at most one extra miss per channel.4
Tests
- 85 tests, including 5 validation gates: (1) perfectly placed KV hits exactly the 0.969 ceiling, (2) random placement lands near the 1/rows floor, (3) contiguous row-hit never drops as blocks grow, (4) the same seed gives byte-identical output, and (5) blocks are conserved every single step, with prefix sharing, spec branches and preemption all on (no block lost or owned twice).
- Seeds: across 3 seeds and 24 configs, row-hit never moves by more than 0.0079.
- Not an artifact of 32 channels: splitting the stack into 1, 2, 4 or 8 independent channel groups (each with its share of KV heads) leaves M1 and M2 identical to three decimals. Bandwidth scales down with the hardware, and the gain stays the same.
- Cold start isn’t what keeps KV-PIMple at 0.963 instead of the 0.969 ceiling, since a sequence’s first row costs an activation either way. The gap is at the other end. Real sequences don’t end on a region boundary, so the last region is only partly filled but still costs a full activation. That’s why every allocator also lands at 0.963 with 128-token blocks. ↩
7. Results
Steady traffic, 16-token blocks, same workload, same pool, only the allocator changes:
| allocator | row-hit (M1) | bandwidth (M3) |
|---|---|---|
| paged (vLLM port) | 0.7695 | 1,226 GB/s |
| KV-PIMple | 0.9633 | 2,805 GB/s |
| contiguous (knows every length up front) | 0.9579 | 2,712 GB/s |
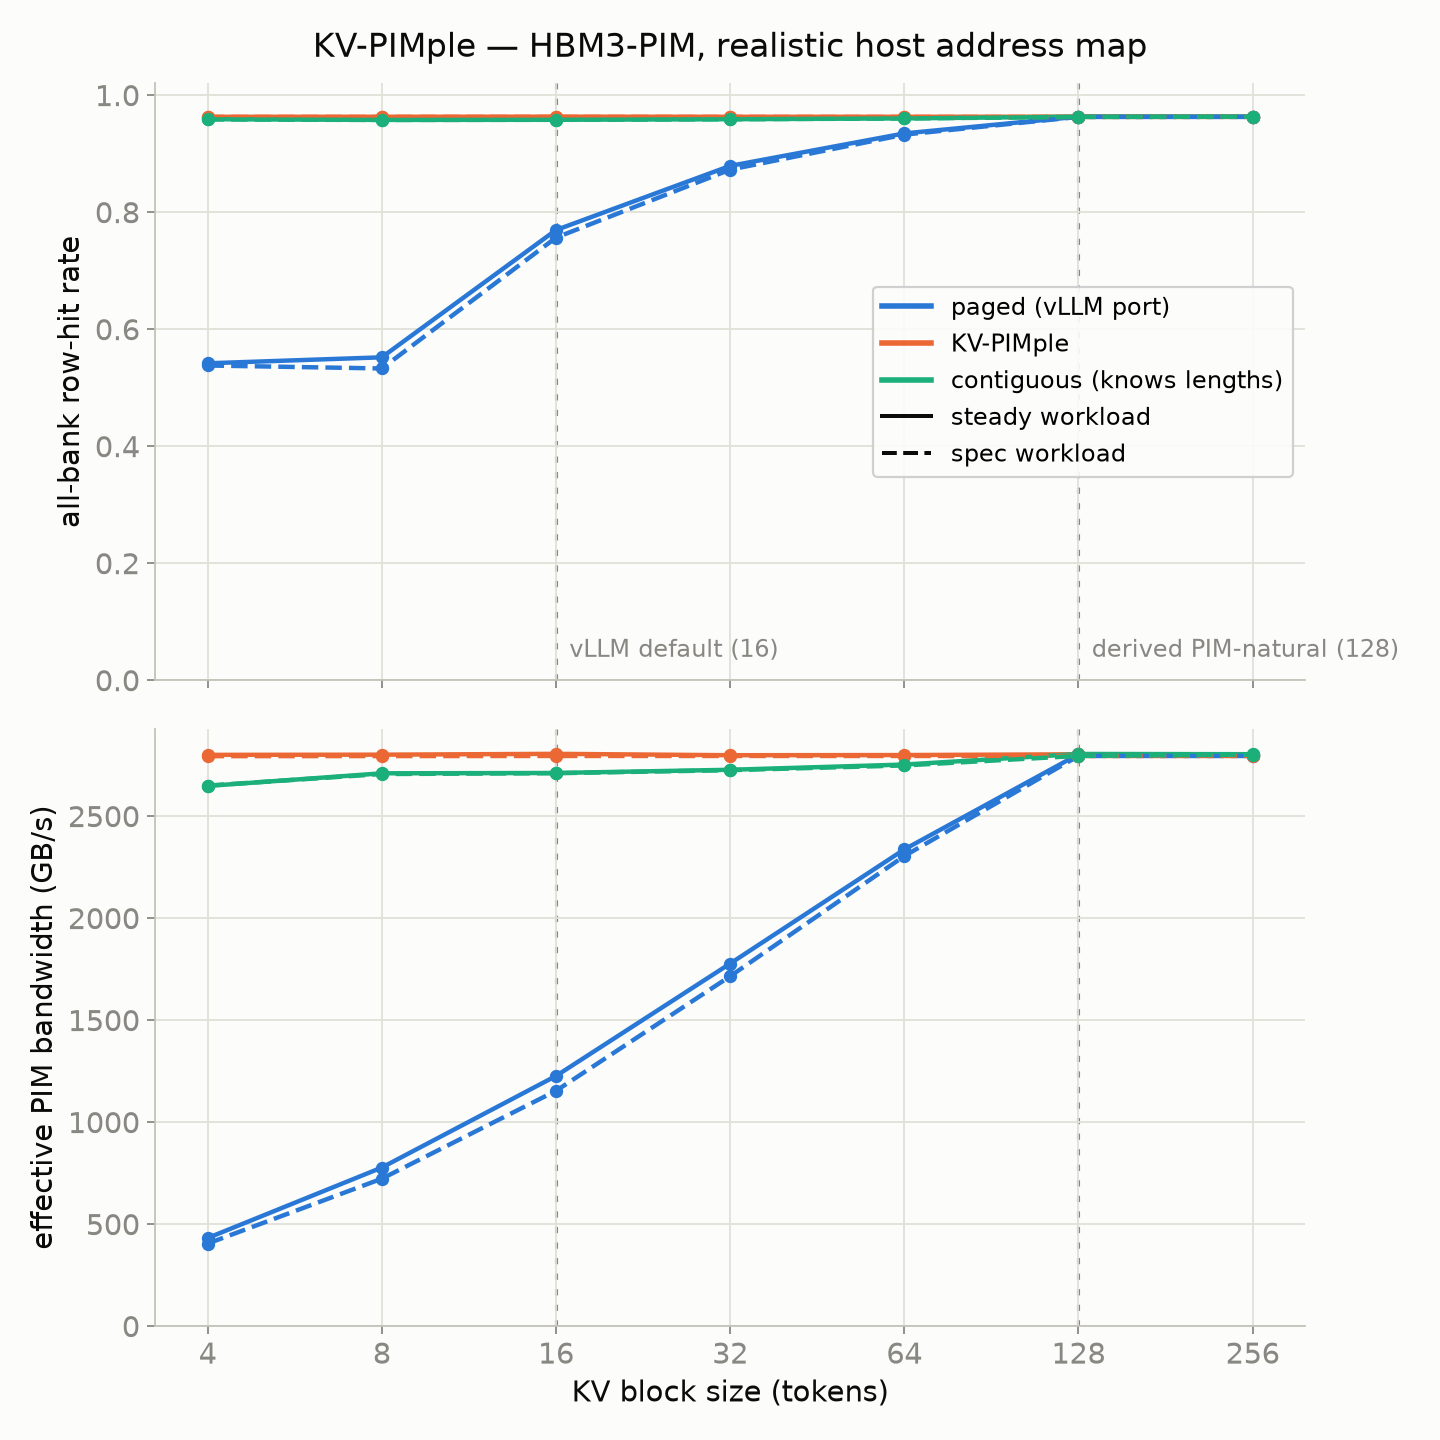
- Uniform across every block size: KV-PIMple sits at 0.963 from 4-token blocks all the way to 256. At 4-token blocks the gap is 6.5×, because paged also leaves half the banks idle there.
- Saturation at bigger blocks: At 128 tokens every allocator scores the same. So you can use 128-token blocks, or keep 16 and allocate by region. The second keeps paging’s packing.
- Contiguity isn’t alignment: The contiguous allocator knows every sequence’s length in advance and still loses slightly, because its spans start anywhere and straddle row boundaries. It also pays in memory, since it can’t share prefixes, and at 1.3× pool headroom it finishes 9% slower from admission stalls. That penalty only goes away at ~2× the pool, which is the exact problem paging solved.
- The rest of the gap isn’t placement: 2,805 GB/s is 74% of ideal. The remainder is the 31/32 ceiling with a 10.5× miss cost, which a smarter PIM controller would have to fix, not an allocator.
Across workloads (16-token blocks):
| workload | paged | KV-PIMple | gain |
|---|---|---|---|
| steady | 1,226 GB/s | 2,805 GB/s | 2.3× |
| speculative decoding | 1,153 GB/s | 2,795 GB/s | 2.4× |
| prefix sharing | 2,042 GB/s | 2,867 GB/s | 1.4× |
| long context | 2,823 GB/s | 2,938 GB/s | 1.04× |
Long context barely cares about the allocator. A 20k-token prompt grabs hundreds of blocks in one prefill burst, which even a LIFO free list serves in long runs, and decode growth is a rounding error next to it. Prefix sharing helps paged too, since the shared prompt gets allocated once, early, and compactly. So the paged penalty is a churn problem, not a length problem, and it’s worst for short and medium contexts, which is most chat traffic.
It also gets worse as models shed KV heads. Fewer heads means fewer bytes per token, so a 16-token block is a smaller slice of a row and paging pays more activations for the same data:
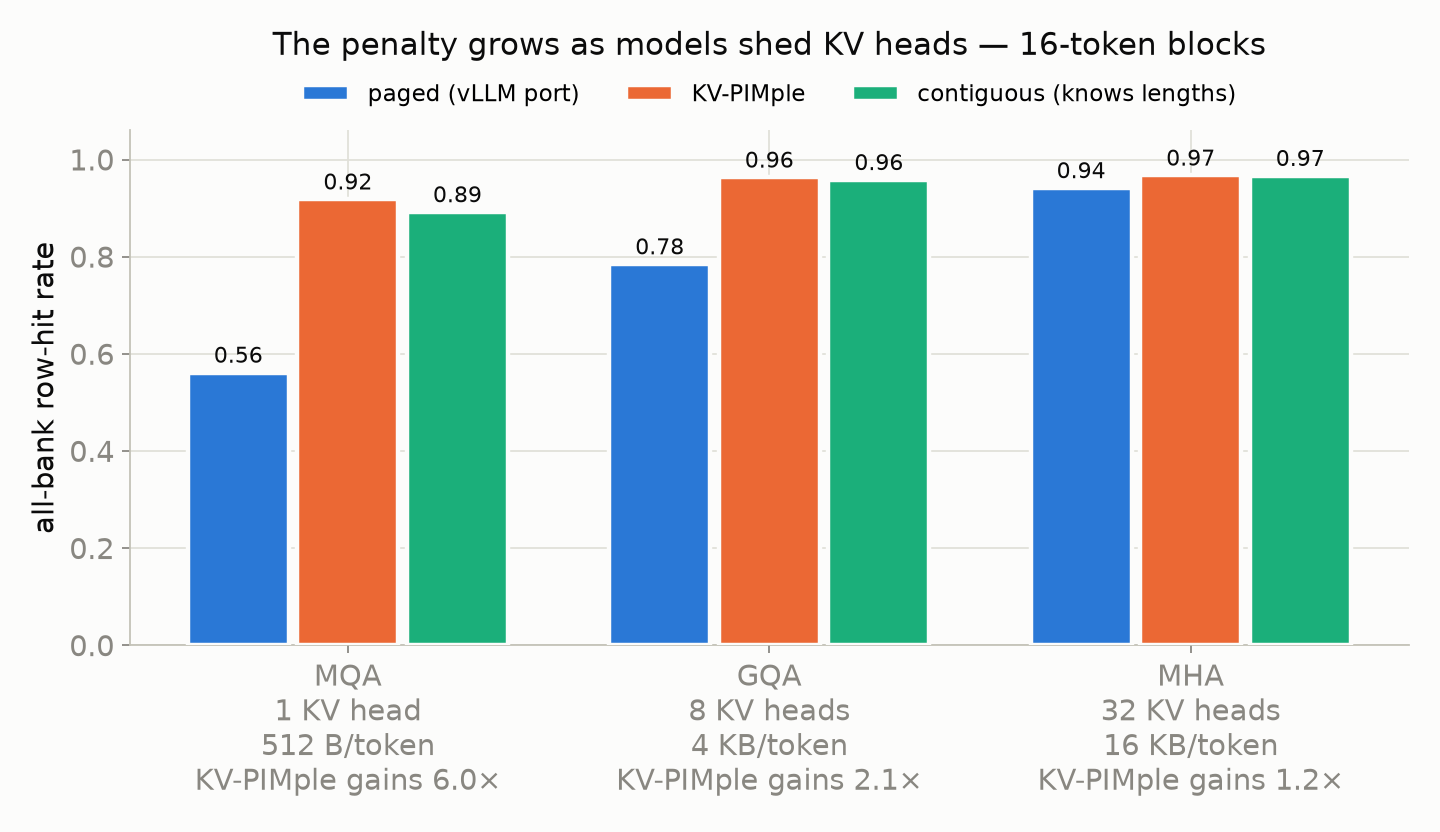
Every KV-compression trend (fewer heads, FP8, INT4) shrinks the bytes per token, so they all widen the gap.
8. Cross-validation
M3 is a formula, not a measurement. To verify it, I ran it through something that actually simulates a DRAM controller cycle by cycle.
Ramulator 2
I captured real block tables from the simulator (3 sequences × 3 allocators), turned them into the exact bursts my model scores, and fed them to Ramulator 2 [7] as pre-decoded addresses, so it sees my address map bit for bit. Its controller does its own FR-FCFS reordering with an open-row policy.
Row-hit agrees to within 0.0023 on average (0.0065 at worst) over all 9 samples. So where the blocks land and which commands hit are not modeling artifacts.
The speedup was a different story. Ramulator saw paged as only 1.24× slower, while my model said 2.1×. That’s because stock Ramulator has no all-bank command. Its banks run independently, so a miss in one bank hides behind work in the others. It just measures the normal DRAM penalty, not the PIM one.
AttAcc
I first vendored AttAcc’s simulator [8] as reference only and assumed the bank-parallelism part couldn’t be checked. I couldn’t be more wrong. It ships a Ramulator 2 extension with exactly the missing piece, a real all-bank MAC command (PIM_MAC_AB) and a PIM controller, on the same geometry as mine.
Two tests:
- Bank participation (M2): switching from the realistic map to the textbook one, my model predicts 8.0× more all-bank commands for the same bytes. AttAcc measures 7.3× more cycles. M2 holds up.
- Speedup: on the same three sequences, my model says KV-PIMple is 2.16× faster than paged. AttAcc says 1.50×.
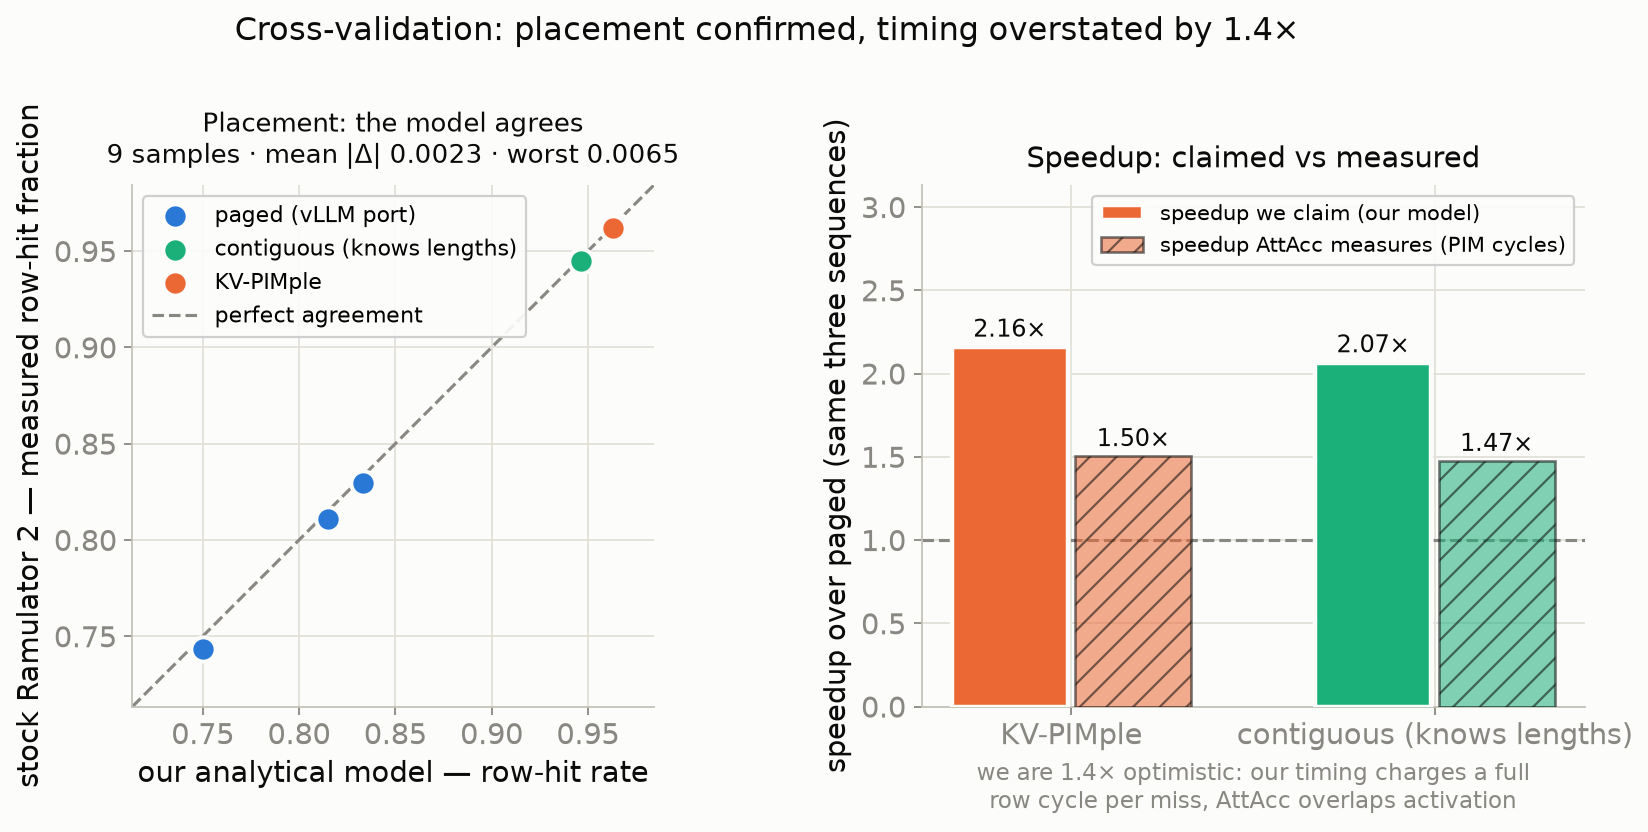
Working backwards from AttAcc’s cycles, a miss effectively costs ~4.4× a hit, not the 10.5× I took from the raw timing parameters. The thing is that my model charges a full row cycle per miss, while a real PIM controller overlaps activations with useful work across banks and channels. So my M3 overstates the benefit by ~1.4×.
That gives the honest headline: 2.3× on published timing, ~1.6× on a cycle-level PIM controller. The direction, the ordering of the allocators, and the block-size story don’t change, except for the magnitude.
9. What Didn’t Work
Speculative Decoding
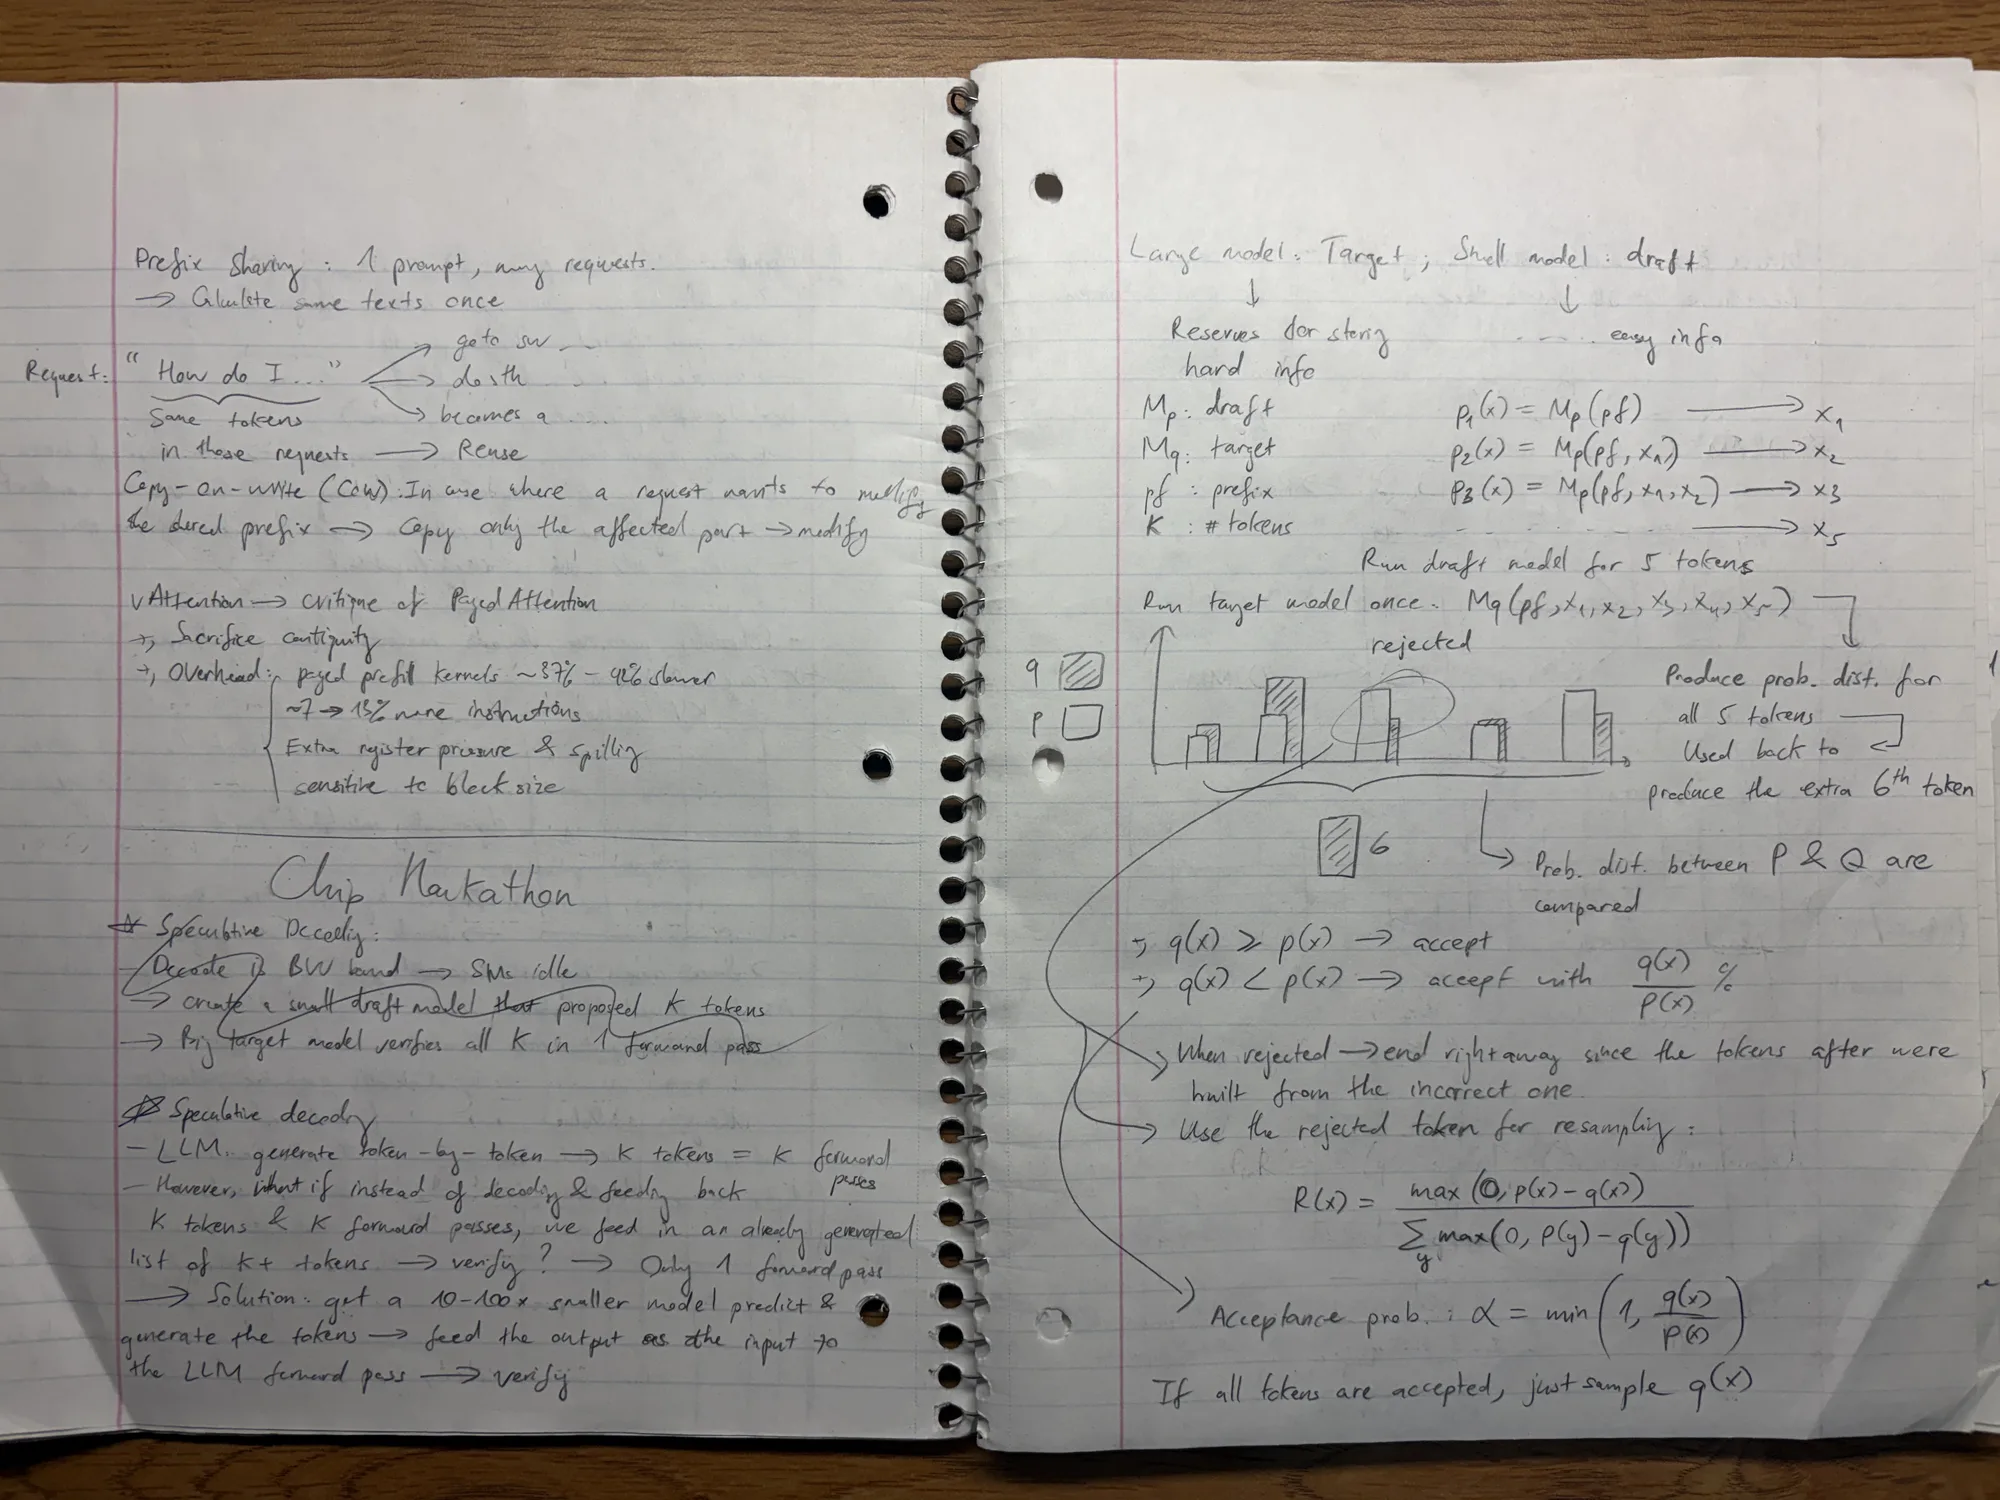
In speculative decoding, each round forks 4 draft branches (3 tokens each), keeps the accepted one, and frees the rest. That’s 110 allocations per step vs 6 on steady traffic. My first version took the draft blocks from the sequence’s own region. The churn punched holes in regions, so they never looked empty, everything fell to the fallback path, and row-hit dropped to about 0.87 at 16-token blocks. A sequence ended up touching more than 3× the regions it needed.
The obvious fixes, one at a time:
| 16-token blocks, spec decoding | row-hit |
|---|---|
| drafts in the sequence’s region (original) | 0.873 |
| copy accepted tokens back, drafts still in the region | 0.871 |
| drafts in a separate scratch area, keep the accepted block | 0.850 |
| separate scratch area and copy back | 0.963 |
Copying back alone changes nothing, since the drafts still churn the sequence’s region. The separate scratch area alone makes it worse, because the accepted block lives in a scratch region forever, so committed blocks end up smeared across scratch space. Only both together work, and then spec decoding looks exactly like steady traffic. The cost is 8.5% more copied bytes (the accepted tokens), on top of the copy-on-write copies every spec engine already pays.
Preemption
The runs so far gave every request the memory it needed. Real vLLM doesn’t. It admits a request if its prompt fits, and when the pool runs out, it preempts the newest sequence, throws away its blocks, and recomputes it later. So I ported that too (preempt-by-recompute from v0.2.7) and shrank the pool.
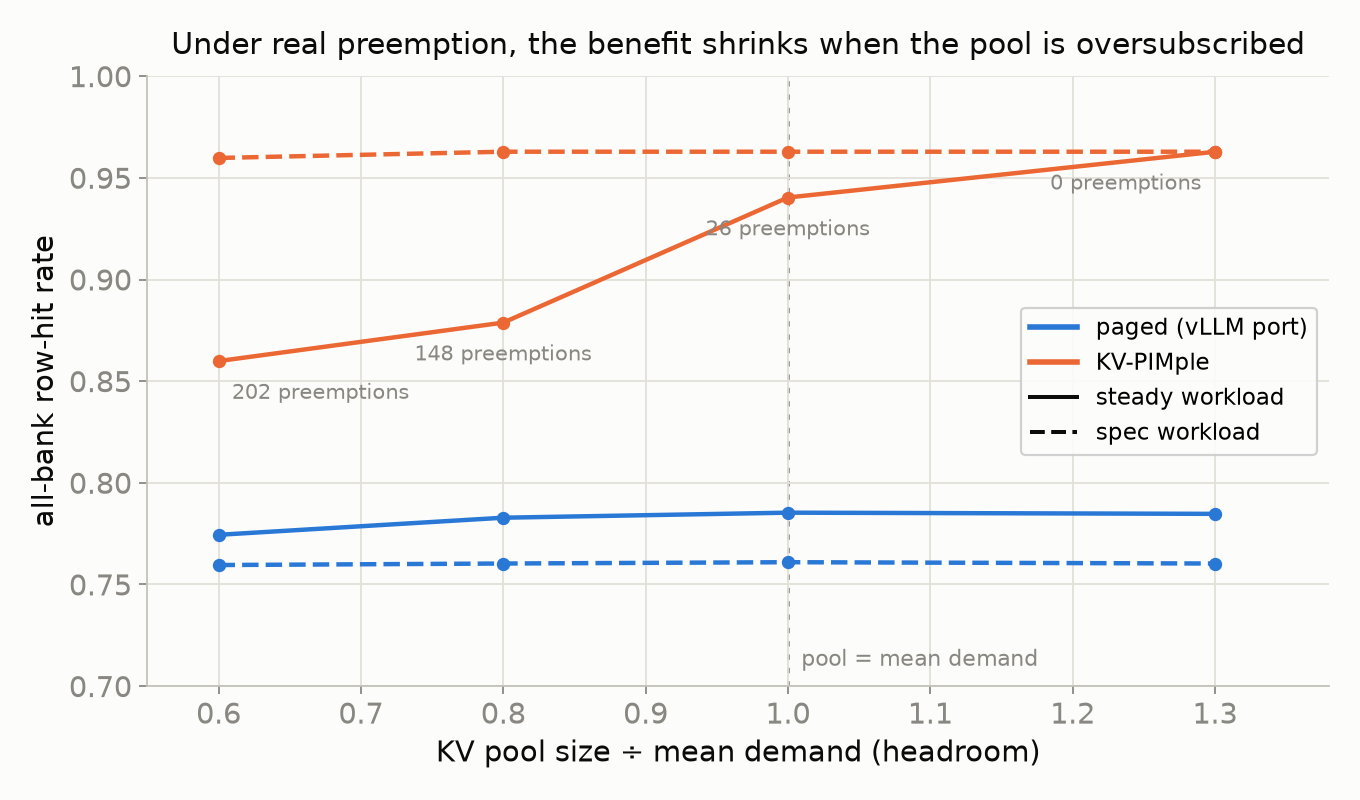
At 0.6× headroom (202 preemptions), KV-PIMple falls from 0.963 to 0.860 and the gain goes from 2.13× to 1.38×. Paged doesn’t care, since its placement is already scattered. A recomputed sequence comes back with a longer prompt all at once, and in an oversubscribed pool there are no empty regions left, so it lands in whatever partial regions the churn left behind.
I tried two fixes:
- Best-fit region planning: plan the whole admission into the fewest regions instead of one region at a time. Exactly zero effect, to three decimals. The greedy path already picked the emptiest region every time, so planning in bulk picks the same ones. The problem is the fragmentation itself, not the rule for picking regions.
- Compaction: when a region gets sparse, move its blocks into fuller regions. Actively harmful. At 1.0× headroom, row-hit went 0.940 → 0.859 while copying over 10,000 blocks. It frees up regions, but it scatters the moved sequence’s own blocks across wherever they fit, and row-hit is per sequence. A correct version would move whole sequences, which is a different and much more expensive algorithm.
Both are still in the code (off by default), so the negative results are reproducible. So KV-PIMple gets its full gain when the pool isn’t oversubscribed, and when it is, it degrades but never drops below paged.
10. Cost
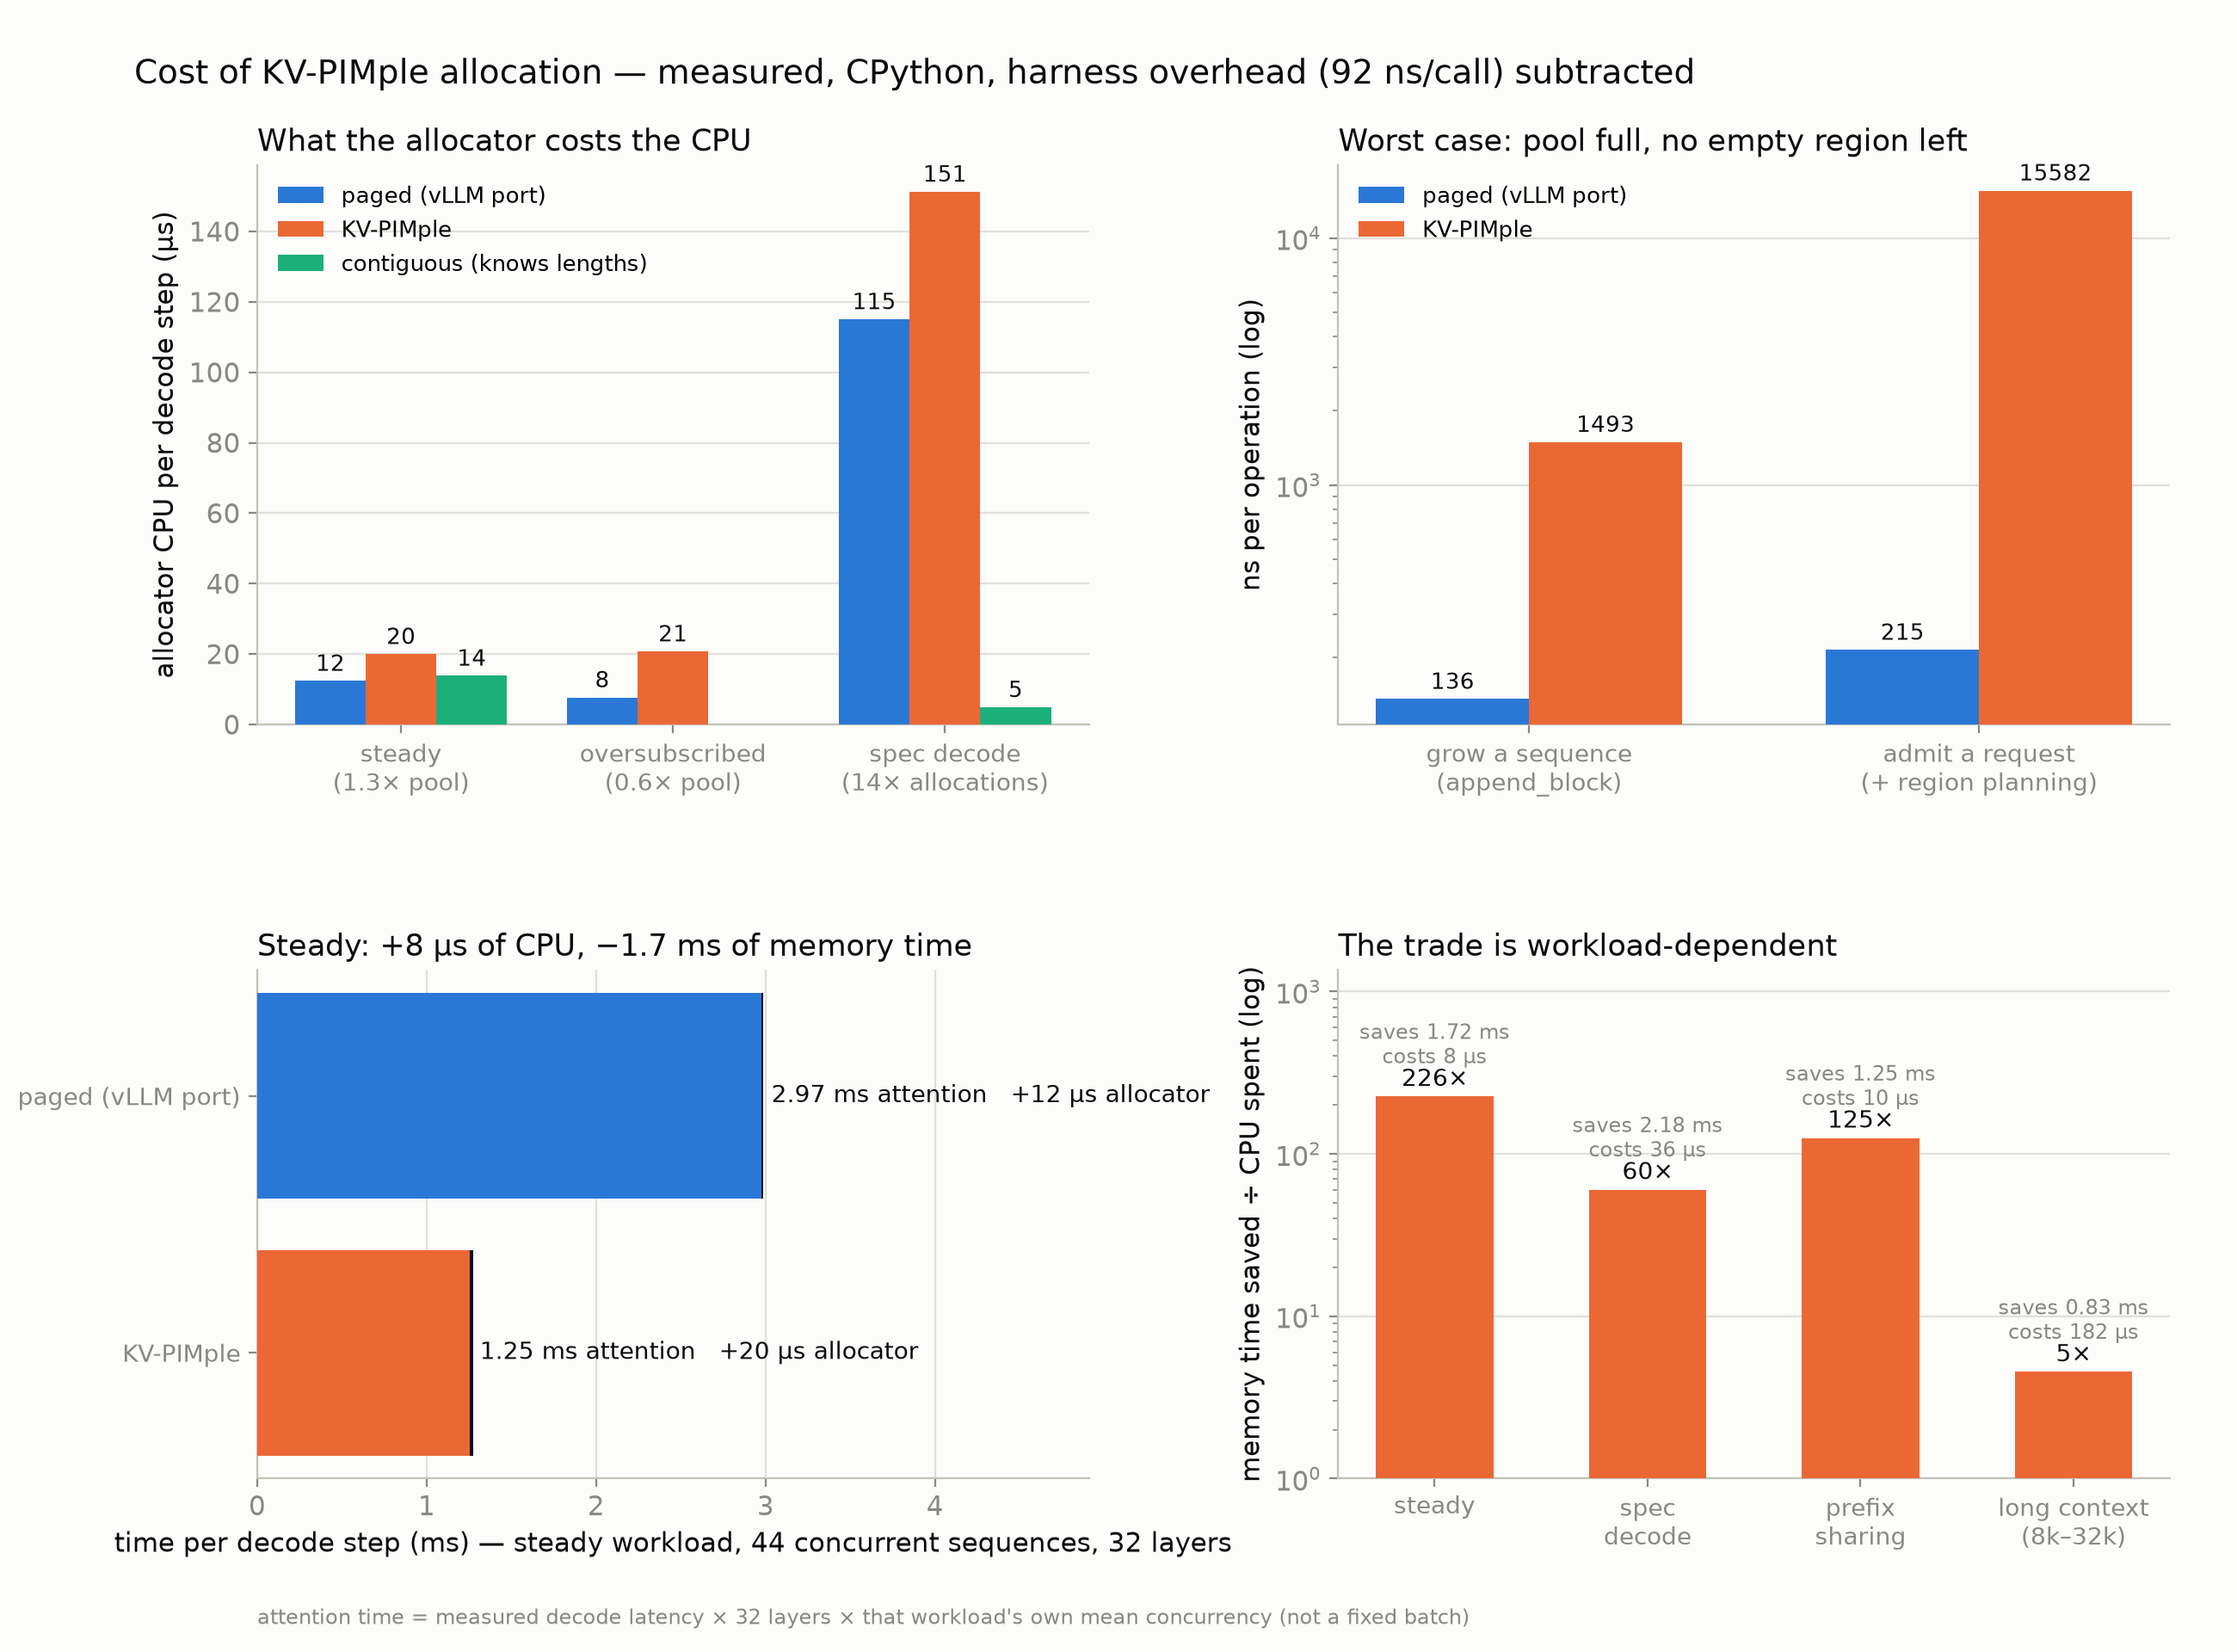
vLLM’s allocator pops a block off a list, one operation. Mine pops the lowest free slot from the sequence’s region, and the lowest empty region when that fills, so it needs ordered structures instead of one list. Intuitively (or obviously), that’s more CPU time. But I wanted to know how much:
| paged | KV-PIMple | |
|---|---|---|
| CPU per block allocation | 1,960 ns | 3,167 ns |
| CPU per decode step (steady) | +8 µs | |
| memory time saved per decode step | 1.7 ms | |
| bookkeeping memory | 113 KiB | 70 KiB |
So it trades a bit of CPU time for a lot of memory time, and uses less bookkeeping memory than the free list. The benefit-to-cost ratio depends on the workload though. It’s 226× on steady, 125× on prefix sharing, 60× on spec decoding (all that churn), and only 5× on long context, where the allocator barely helps to begin with.
The worst case is a full pool with no empty region left. There, growing a sequence costs 1.5 µs vs 136 ns, and admitting a request costs 15.6 µs vs 215 ns, because the fallback scans every region. Most of that admission cost is the best-fit planning from section 9, which I measured as a no-op, so it can be dropped.
KV Tensor Layout. One simplification I made was storing K and V together, 4 KB per token in one tensor. vLLM actually keeps K and V in two separate tensors, and for a good reason. The GPU kernel reads them differently, so each gets its own layout. Keys are stored in 16 B chunks so a key vector loads in wide reads for the Q·K dot product, and values are stored with the tokens next to each other since the second step sums over tokens (cache_engine.py [3]). For PIM though, it means each tensor only sees 2 KB per token, so a block is 32 KB and 16 of them fill a row. Paged still pays one activation per block, but now each activation covers half as many reads.
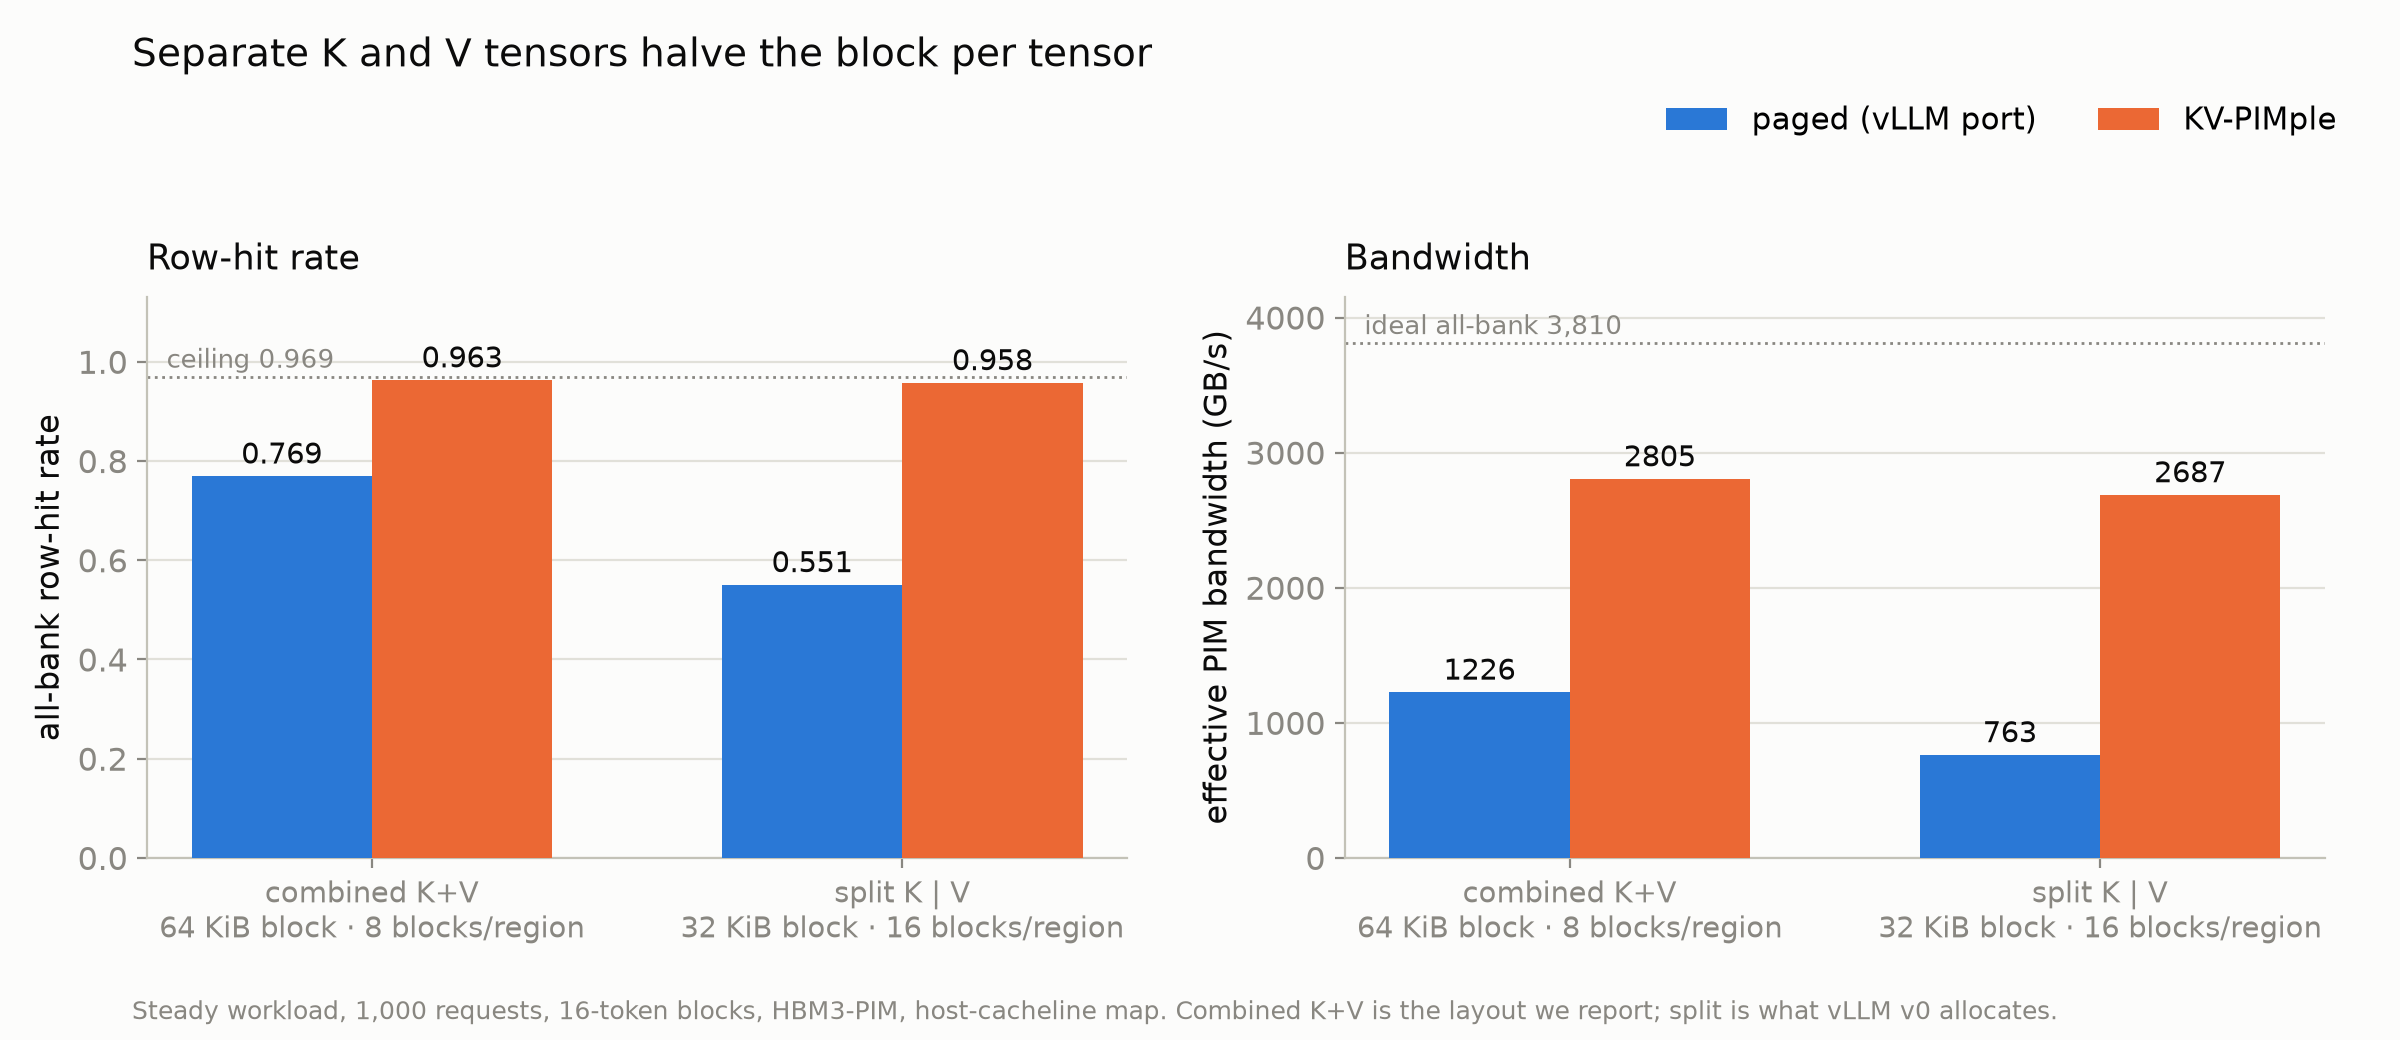
Paged row-hit drops 0.77 → 0.55, KV-PIMple stays at 0.96, and the gain goes from 2.3× to 3.5×. This isn’t a case against splitting K and V, which is the right call for the GPU kernel. It just means a PIM-aware allocator matters even more with vLLM’s real layout, and my simplification understates the gain rather than inflating it. This one is a proxy though (one tensor at half the size), not a real two-stream simulation.
11. Related Work
The idea is not entirely new, and I want to be upfront about that.
I didn’t know about most of this work when I started. I leaned too much on Claude for the literature search this time, and only found other papers near the end of the build, while putting together the related-work slides.
That’s on me.
Here’s how I place the closest work (summarized from reading, I didn’t re-implement any of them):
- NeuPIMs [5] says it uses vLLM-style paging, so I went through their code to check. Their pages are whole row groups (keys get a new row every 32 tokens, values every 512), so they’re aligned by construction. That’s the grow-the-block lever. On their own ShareGPT traces, that granularity leaves 52.9% of used KV reserved but empty, vs 2.4% with 16-token blocks. Their shipped simulator also never grows or frees the KV cache (
output_sizeis hardcoded to 1), which is a reasonable simplification for a throughput study, but it means the free-list churn I’m measuring never happens there. - PIMphony [9] has a chunk that’s the same object as my region, with a different constant (1 MB on their geometry). Their chunk belongs to one request, and I didn’t see a fallback for a busy server or prefix sharing.
- BlockPIM [10] (DAC ’25) derives the block size as banks × row ÷ bytes per token (256 tokens on their HBM3 config), so one block = one all-bank operation. Same idea, but it grows the block instead of keeping vLLM’s 16, so the granularity gets coarser.
- PATTON [11], posted on Sep 10 during the build week, is the closest. Their hierarchy goes from one burst in every bank, to one vLLM 16-token block, to a request-owned group of 16 blocks, which is basically my region. Same placement order, same finding that coarse aligned reservations cost memory under pressure, and even the same staging trick (write somewhere temporary, copy into an aligned spot later). They use it for half-filled blocks, I used it for spec decoding.
What I think still stands:
- I measured the plain-vLLM baseline on PIM. PATTON compares 4 PIM allocators (NeuPIMs, AttAcc, BlockPIM, PIMphony), not paging as vLLM actually does it.
- I explained why the unit has the size it does and derived it from the geometry. PATTON uses a fixed 16 blocks per group, picked as the best config.
- I measured preemption-by-recompute (2.13× → 1.38×), the controller reorder window, batch size, and spec decoding with copy-on-write.
And to be fair to them, they cover things I don’t, like the write path, K/V asymmetry, prefix caching, real engine integration, different hardware, and probably way more thorough testing than mine.
12. Concerns
- All simulated. No hardware, no GPU, no real inference. One representative layer, and reads only. I only measured where the KV goes, not the cost of writing it.
- vLLM was never run. I ported its allocation policy from v0.2.7, which is old. I didn’t check how much newer vLLM versions changed it.5
- 2.3× is optimistic. It’s ~1.6× on AttAcc’s cycle-level controller. Any time you quote the first number, quote the second.
- The controller matters. My model reorders within a 64-burst window. With no reordering at all, the gain is 1.24×, but then every allocator is capped at ~12% of ideal, so the controller is the bottleneck, not placement. A real controller sits somewhere in between.
- The K/V split result is a proxy, not a two-tensor simulation.
- One more fidelity gap, in the baseline’s favor. Real vLLM frees a finished sequence’s blocks by iterating a
set, so the order is arbitrary. I free them in block-table order to keep runs deterministic. That slightly tidies paged’s free list, so if anything it flatters the baseline. ↩
13. Conclusion
The fix itself is small. It’s one rule in the block manager, derived from a division, and the hardware never knows. Most of the time went into proving it honestly: the kill test, the three metrics, two external simulators, and measuring the cost of my own fix and the cases where it barely helps.
My lessons:
- Measure the baseline before building the fix, with a stop rule written down first. It’s the only reason I caught the false metric.
- Never judge on one metric. Row-hit said 0.970 while bandwidth was at 9.7% of ideal.
- Always validate against other work/simulators
- Measure the cost of the fix too, including the cases where it barely helps (long context, heavy preemption).
Next steps, in order of how much they would change the numbers:
- Calibrate M3 against AttAcc’s timing, so the headline is the cycle-level number by default.
- Simulate K and V as two real streams instead of a one-tensor proxy, and add the KV write path.
- Compaction that moves whole sequences, to recover the gain under preemption.
- Integrate the policy into a real vLLM block manager.
If you want to try it, setup is Python 3.11+ with numpy, pandas, matplotlib and pyyaml:
make install        # venv + editable install (no uv? use: make install-pip)
make test           # 85 tests incl. the 5 validation gates, ~3-5 min
Then these two commands give the headline (~45 s each, same seed, same workload, only the allocator changes):
.venv/bin/python -m pimkv.run --workload steady --allocator paged \
  --addrmap host-cacheline --block-tokens 16 --requests 1000 --seed 0

.venv/bin/python -m pimkv.run --workload steady --allocator pim-aware \
  --addrmap host-cacheline --block-tokens 16 --requests 1000 --seed 0
You should get 0.7695 / 1226.3 GB/s, then 0.9633 / 2805.4 GB/s, with frame_spread 6.10 vs 1.00.
Update: I didn’t get into the finals, and honestly the finalists deserved it. AI agents for IC physical design, laser drone detection, neural networks built on a breadboard,... just to name a few. Their work is way more impressive than mine.
Still, it was worth it for me. In one month I learned how LLM serving works, from attention and the KV cache to vLLM’s paging, and how DRAM and PIM behave at the row and bank level. And I came out of it with a real project.
Bonus: My Notes
A few pages from my notebook while I was learning all this, in the order I went through it.
See you in the next one!
References
- J. Park et al., “AttAcc! Unleashing the power of PIM for batched transformer-based generative model inference,” in Proc. 29th ACM Int. Conf. Archit. Support Program. Lang. Oper. Syst. (ASPLOS), vol. 2, 2024, pp. 103–119, doi: 10.1145/3620665.3640422.
- W. Kwon et al., “Efficient memory management for large language model serving with PagedAttention,” in Proc. 29th Symp. Oper. Syst. Princ. (SOSP), 2023, pp. 611–626, doi: 10.1145/3600006.3613165.
- vLLM Project, “vLLM v0.2.7,” GitHub. [Online]. Available: https://github.com/vllm-project/vllm/tree/v0.2.7
- S. Lee et al., “Hardware architecture and software stack for PIM based on commercial DRAM technology: Industrial product,” in Proc. ACM/IEEE 48th Annu. Int. Symp. Comput. Archit. (ISCA), 2021, pp. 43–56, doi: 10.1109/ISCA52012.2021.00013.
- G. Heo et al., “NeuPIMs: NPU-PIM heterogeneous acceleration for batched LLM inferencing,” in Proc. 29th ACM Int. Conf. Archit. Support Program. Lang. Oper. Syst. (ASPLOS), vol. 3, 2024, pp. 722–737, doi: 10.1145/3620666.3651380.
- Y. Jung, S. M. Anik, B. K. Lee, and J. Ryoo, “RH+: Row-hit-optimized scheduling for PIM-based LLM inference,” 2026, arXiv:2606.05511.
- H. Luo et al., “Ramulator 2.0: A modern, modular, and extensible DRAM simulator,” IEEE Comput. Archit. Lett., vol. 23, no. 1, pp. 112–116, 2024, doi: 10.1109/LCA.2023.3333759.
- SNU SCALE Lab, “AttAcc simulator,” GitHub. [Online]. Available: https://github.com/scale-snu/attacc_simulator
- H. Kwon et al., “PIMphony: Overcoming bandwidth and capacity inefficiency in PIM-based long-context LLM inference system,” 2024, arXiv:2412.20166.
- Z. Li, J. Zhou, X. Li, and N. Sun, “BlockPIM: Optimizing memory management for PIM-enabled long-context LLM inference,” in Proc. 62nd ACM/IEEE Design Autom. Conf. (DAC), 2025, pp. 1–7, doi: 10.1109/DAC63849.2025.11133193.
- H. Kim, S. Lee, T. Suh, and J.-Y. Kim, “PATTON: Enabling commodity PIM for production LLM serving,” 2026, arXiv:2609.11392.