Reverse Engineering NVIDIA L2 Cache (RTX 3060)
Back in July, I was tinkering around with Accel-Sim [1] to learn more about GPU microarchitecture. What’s a better way to learn than doing?
On the way, I found many issues, but the biggest of them all is the L2 cache, where the write hits appear all over the place. As an attempt to fix it, I wrote a new counter, ran the correlations on two test suites, wrote a microbenchmark, and built a merge buffer into the simulator. It all ended up in PR #141 (which I titled “GAME CHANGER!!!” on GitHub), and it got merged in August.
Yeah, another post just two days after the last one. Not because I’m suddenly productive. I already had to take my laptop out for the H100 benchmark, and you already know how deadbeat that thing is, so might as well write a blog on the old work. That laptop is also where everything from July lives: the old settings, the plots, the source code, and my old Claude chat logs. Might as well write this one now, so I don’t have to take it out again.
Also, the title is kinda clickbait. All I found was one counter that NVIDIA seems to count differently, plus a merge buffer that didn’t make it. But it’s technically reverse engineering, so I’m keeping it.
- the PR
- accel-sim/gpgpu-sim_distribution #141 (merged)
- the follow-up
- the
LOCAL_ACC_Wfix, part of accel-sim-framework #551 (still open) - the simulator
- github.com/accel-sim/gpgpu-sim_distribution (the cache lives in
src/gpgpu-sim/gpu-cache.cc)
TL;DR
- The problem: on streaming-write microbenchmarks, Accel-Sim reported ~0% L2 write hits while my real RTX 3060 reported ~100%. On Rodinia, some apps matched exactly and others were off by up to 6× (srad_v2: sim 4,128 vs. hardware 24,576).
- The fix: in GPGPU-Sim, a write to a line that was never read is a
MISS, even though the L2 keeps the data (the textbook way). NVIDIA seems to count it as a hit. A new stats-only counter,WRITE_ALLOCATED, makesHIT + WRITE_ALLOCATEDline up: correlation 0.88 → 0.999 on 10 Rodinia apps. Merged. - Found along the way:
- NVIDIA’s L2 write counters include local memory (register spills), but the sim side only read global writes. Adding them fixed RAY and LIB, and ISPASS went from −0.06 to 0.9999 correlation (#1).
- Real hardware seems to merge writes to the same sector somewhere between L1 and L2. A 4-entry merge buffer cut the mean L2 write error from 19.10% to 2.33% on 32 apps, but my own microbenchmark proves it can’t be the real mechanism, so I scrapped it (#2).
- Update (Oct 31): I finally tested the assumption under all of this. The real 3060’s L1 is write-through and allocates without fetching, same as the config. And 99.8% of L2 writes count as hits, even in a kernel too big to fit in L2 (update).
1. Setup
Quick context for those who haven’t used the GPU simulator, Accel-Sim has a correlation flow: run an app on a real GPU under Nsight Compute (ncu), run the same app in the simulator, then plot every counter as hardware vs. sim, one point per app. If the sim is right, every point sits on the diagonal. If not, you go find out why.
My GPU is an RTX 3060 Laptop (GA106, Ampere, 3 MB of L2), with the config from my other PR #140. The apps come from Rodinia 2.0-ft [2], ISPASS-2009 [3] and Accel-Sim’s GPU_Microbenchmark suite (the last post describes the first two).
The counter this whole post is about is lts__. Reading it left to right: an L2 slice’s tag stage (lts__t), sectors, coming from the SM’s L1TEX unit (srcunit_tex), write ops, whose tag lookup hit. In short, “L2 write hits”.
Note: All the code, code blocks, function names and config lines in this post refer to Accel-Sim 1.x, specifically the GPGPU-Sim commit where PR #141 got merged (Aug 12, 2026), not 2.0. 2.0 reworked a lot of the memory side (l2cache.cc and shader.cc alone changed by hundreds of lines), so the details and line numbers may not match the current code. The WRITE_ALLOCATED counter itself is still there in the current code.
2. How the L1 Talks to the L2
Before the bug, some background on how GPGPU-Sim models the two caches. Both run the same code, and the differences come from a config string. Here are the L1 and L2 lines from my 3060 config:
-gpgpu_cache:dl1 S:4:128:64,L:T:m:L:L,A:384:48,16:0,32
-gpgpu_cache:dl2 S:64:128:16,L:B:m:L:P,A:192:4,32:0,32
The fields that matter here:
| field | L1 | L2 |
|---|---|---|
| type | S sectored | S sectored |
| sets : line size : ways | 4 : 128 B : 64 | 64 : 128 B : 16, per sub-partition (× 24 = 3 MB) |
| replacement | L LRU | L LRU |
| write policy | T write-through | B write-back |
| allocate | m on miss | m on miss |
| write-allocate | L lazy fetch on read | L lazy fetch on read |
“Sectored” means each 128 B line is split into four 32 B sectors, and each sector has its own valid and modified bits. Data moves between L1, L2 and DRAM in sectors, not whole lines. So a line can be in the cache with only 1 of its 4 sectors actually there.
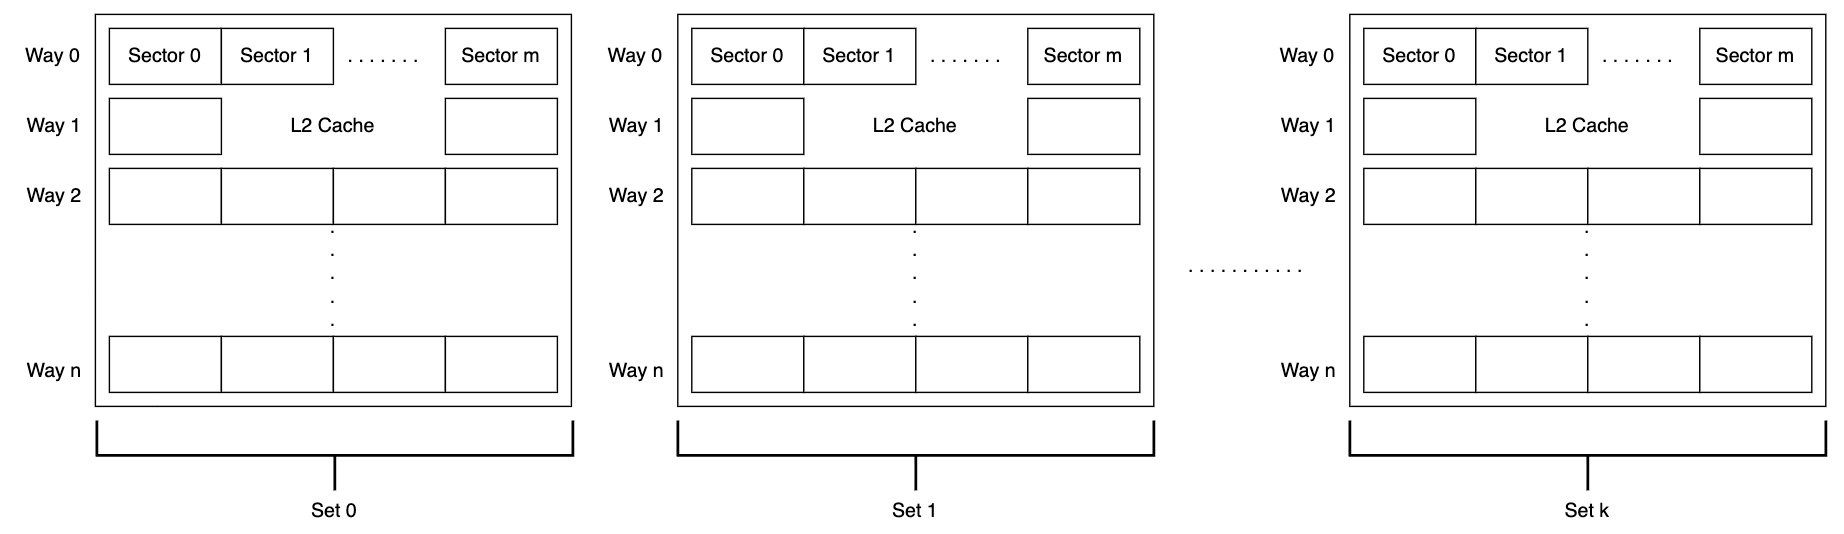
Read Path
- A warp runs a load. The coalescer (
warp_inst_t::memory_coalescing_arch) groups the 32 threads’ addresses by the 32 B sector each one falls in. Threads in the same sector share one request, and every other sector touched gets its own. So with 4 B loads, 32 threads reading 128 consecutive bytes become 4 requests, while 32 threads scattered all over memory become 32. - The L1 checks its tags (
tag_array::probe), and the access ends up as one of these:HIT: the sector is there.MISS: no line with that tag, so a line gets allocated (evicting one if needed).SECTOR_MISS: the line is there, but this sector isn’t.HIT_RESERVED: someone already asked for this sector, and the data is on its way.RESERVATION_FAIL: no room right now, so try again next cycle.1
- On a read miss, the request takes an MSHR entry and goes into the L1’s miss queue (if an MSHR for that sector already exists, it just merges into it and nothing new is sent). Writes skip the MSHR and go straight into the same queue.2 Every cycle, the request at the front of that queue moves into the interconnect (
baseline_cache::cycle). One per cycle, first in first out. Keep this FIFO in mind for section 8. - The interconnect delivers it to one of the 24 L2 sub-partitions, which checks its own tags the same way. Each address lives in exactly one sub-partition, so together they’re still one shared L2, just split into banks by address (2 per memory channel, 12 channels). This is GPGPU-Sim’s naming, not the “partitioned L2” that A100 and H100 have (more on that in the concerns).
- L2 hit: the data goes back up. L2 miss: go to DRAM, fill the L2, then go back up and fill the L1.
Inside each cache, data_cache::access probes the tags, and process_tag_probe hands the result to one of four handlers. The handlers are function pointers picked from the config, so there’s no giant if-else for every policy:
if (wr) {  // Write
  if (probe_status == HIT)
    access_status = (this->*m_wr_hit)(addr, cache_index, mf, time, events, probe_status);
  else if (probe_status != RESERVATION_FAIL ||
           m_config.m_write_alloc_policy == NO_WRITE_ALLOCATE)
    access_status = (this->*m_wr_miss)(addr, cache_index, mf, time, events, probe_status);
} else {   // Read
  if (probe_status == HIT)
    access_status = (this->*m_rd_hit)(addr, cache_index, mf, time, events, probe_status);
  else if (probe_status != RESERVATION_FAIL)
    access_status = (this->*m_rd_miss)(addr, cache_index, mf, time, events, probe_status);
}
Whatever comes back gets counted into the stats (HIT, MISS, SECTOR_MISS, …) per access type. The correlation scripts read those printed stats.
Write Path
Writes are different. The L1 is write-through, so every store gets forwarded to L2, hit or miss (wr_hit_wt calls send_write_request on every hit). The L2 is write-back, so it keeps the data, marks the sector modified, and only writes it to DRAM when the line gets evicted.
So for writes, the L2 is where the data stops. That’s the important part.
- The tag probe returns
RESERVATION_FAILwhen every line in the set is reserved (all of them waiting on data). The handlers return it when the MSHRs or the miss queue are full. ↩ - An MSHR (Miss Status Holding Register) tracks a miss that’s waiting for data: which sector was asked for and which requests are waiting on it, so the fill can wake them up and a second miss to the same sector can merge in. A store already carries its data, and with lazy fetch nothing comes back to fill the L1, so there’s nothing to track. In the code,
m_mshrs.addonly shows up insend_read_request, whilesend_write_requestjust pushes ontom_miss_queue. Writes still get acked by the L2, but that’s a per-warp counter (m_stores_outstanding), and a warp can’t exit until it hits 0. This only holds for lazy fetch though:wr_miss_wa_naive(always) andwr_miss_wa_fetch_on_write(on a partial-sector write) also send a read, and that read takes an MSHR like any load. ↩
3. Cache Policies
Here are some keywords we should know:
- hit / miss
- Decided by the tag lookup the moment an access arrives. Is there already a slot for this sector in the cache? The size of the access doesn’t matter.
- full / partial write
- How many of the sector’s 32 bytes the write covers. This only matters on a miss.
- allocate
- Make a slot for the sector in the cache. If the set is full, evict the least recently used (or any other eviction policy) line first (a dirty one gets written down before it’s dropped). Nothing is read from memory.
- fetch
- Read the sector’s 32 bytes from the level below into that slot.
- forward
- Send the written bytes to the level below.
Write hits are handled by the write policy from section 2 (write-through forwards, write-back doesn’t). Write misses are handled by the write-allocate policy, which decides whether to allocate and when to fetch.
Why fetch at all? A slot holds 32 bytes. A full write fills all of them, so nothing is missing. A partial write of 4 bytes leaves 28 unknown ones, and someone has to get their real values before anyone reads them.
GPGPU-Sim has four write-allocate policies, picked by the 4th letter of the policy field:
| letter | handler | on a write miss |
|---|---|---|
N | wr_miss_no_wa | Don’t allocate. Just forward the write down. |
W | wr_miss_wa_naive | Allocate, forward the write, and always fetch the sector right away, even on a full write (where that fetch is wasted). This is the old GPGPU-Sim 3.x behavior. |
F | wr_miss_wa_fetch_on_write | Allocate. Full write: done, nothing to fetch. Partial write: fetch the sector right away and merge it with the written bytes. |
L | wr_miss_wa_lazy_fetch_on_read | Allocate and keep the written bytes. Full write: done. Partial write: don’t fetch now, only fetch if someone reads that sector later. |
F and L only differ on partial writes. F fetches right away, so the sector is always complete and a later read hits. L waits, and keeps a byte mask of which bytes are real, so data nobody reads never gets fetched. Everything here works per 32 B sector because both caches are sectored. A non-sectored cache does the same thing per 128 B line.
My config uses L for both caches, and everything after this point assumes the real 3060 does too.
What if the hardware actually uses a different write-miss policy?
Read the my BIGGEST mistake.
The code comment points to Jouppi’s “Cache write policies and performance” (ISCA 1993) [4] for the difference between fetch-on-write and write-validate. Lazy fetch on read is basically write-validate: keep track of which bytes are valid instead of fetching.
Here’s the handler, trimmed:
// wr_miss_wa_lazy_fetch_on_read, trimmed
if (m_config.m_write_policy == WRITE_THROUGH)
  send_write_request(mf, ...);            // L1: forward the write to L2

m_tag_array->access(block_addr, ...);     // allocate the line (may evict one)
block->set_status(MODIFIED, mf->get_access_sector_mask());
block->set_byte_mask(mf);                 // remember which bytes we have

if (mf->get_access_byte_mask().count() == m_config.get_atom_sz())
  block->set_m_readable(true, ...);       // all 32 bytes written: readable now
else
  block->set_m_readable(false, ...);      // partial: fetch the rest on a read
...
return MISS;
The “lazy” part happens on the next read. When a load probes a sector that is MODIFIED but not readable (only some of its bytes were written), tag_array::probe returns SECTOR_MISS, and only then does the cache go fetch the rest.
Now look at the last line: return MISS. The write never went near DRAM, the line now lives in L2 with the data in it,3 and the stats still say MISS. Every write-miss handler returns MISS when it succeeds, whatever it actually did.
- The L2 even sends the write acknowledgement back to the SM right away, in
memory_sub_partition::cache_cycle. With write-back and lazy fetch, once the L2 accepts a write there’s nothing left to wait for. ↩
4. 0% vs. 100%
On streaming-write microbenchmarks (write an output array once, never read it), the sim reported ~0% L2 write hits while the hardware reported ~100%, giving a negative correlation (−0.05 to −0.12). On multiple Rodinia apps, the sim also under-counted L2 write hits, by A LOT (srad_v2: sim 4,128 vs. hardware 24,576). But on some other apps, the sim matched the hardware counter exactly (hotspot: 1,962 vs. 1,962). That led me to believe there was another stat we didn’t account for when calculating L2 write hits.
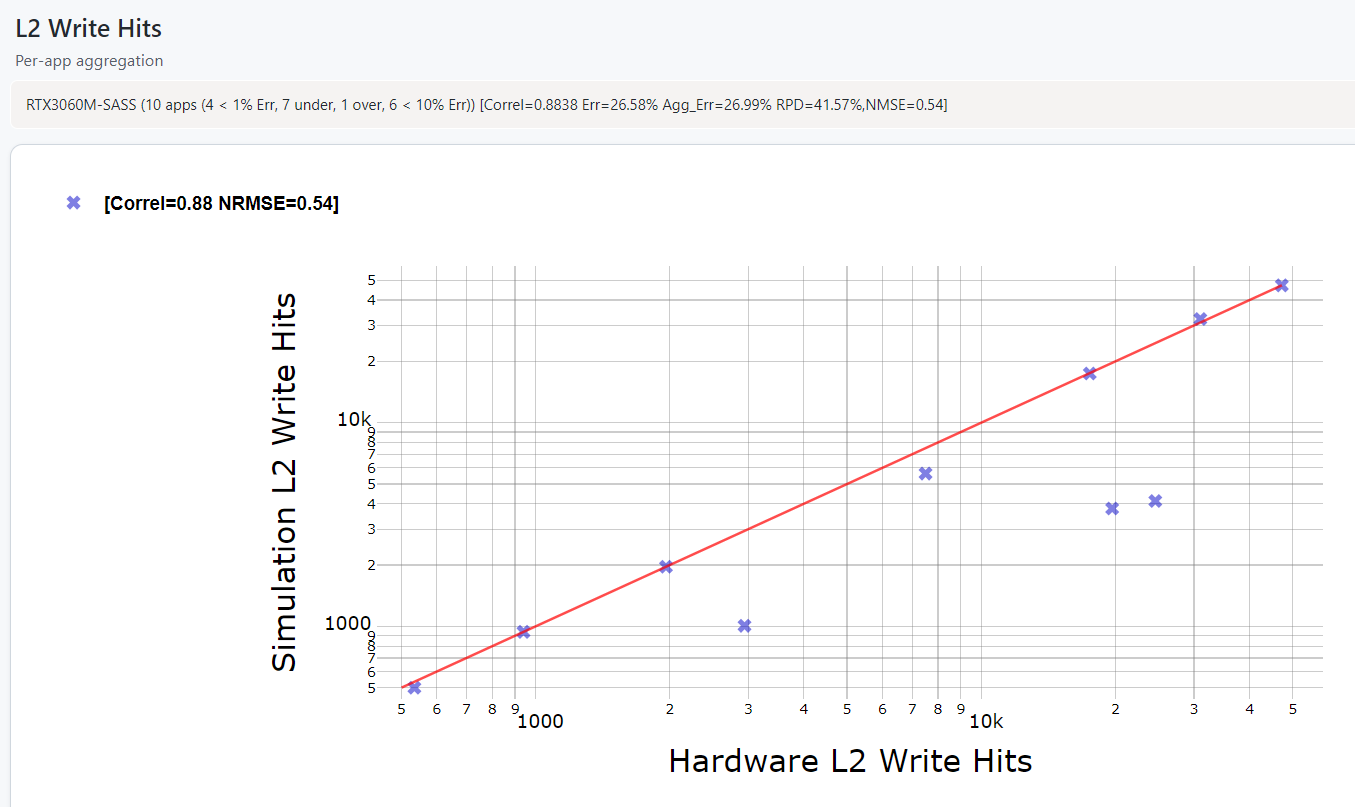
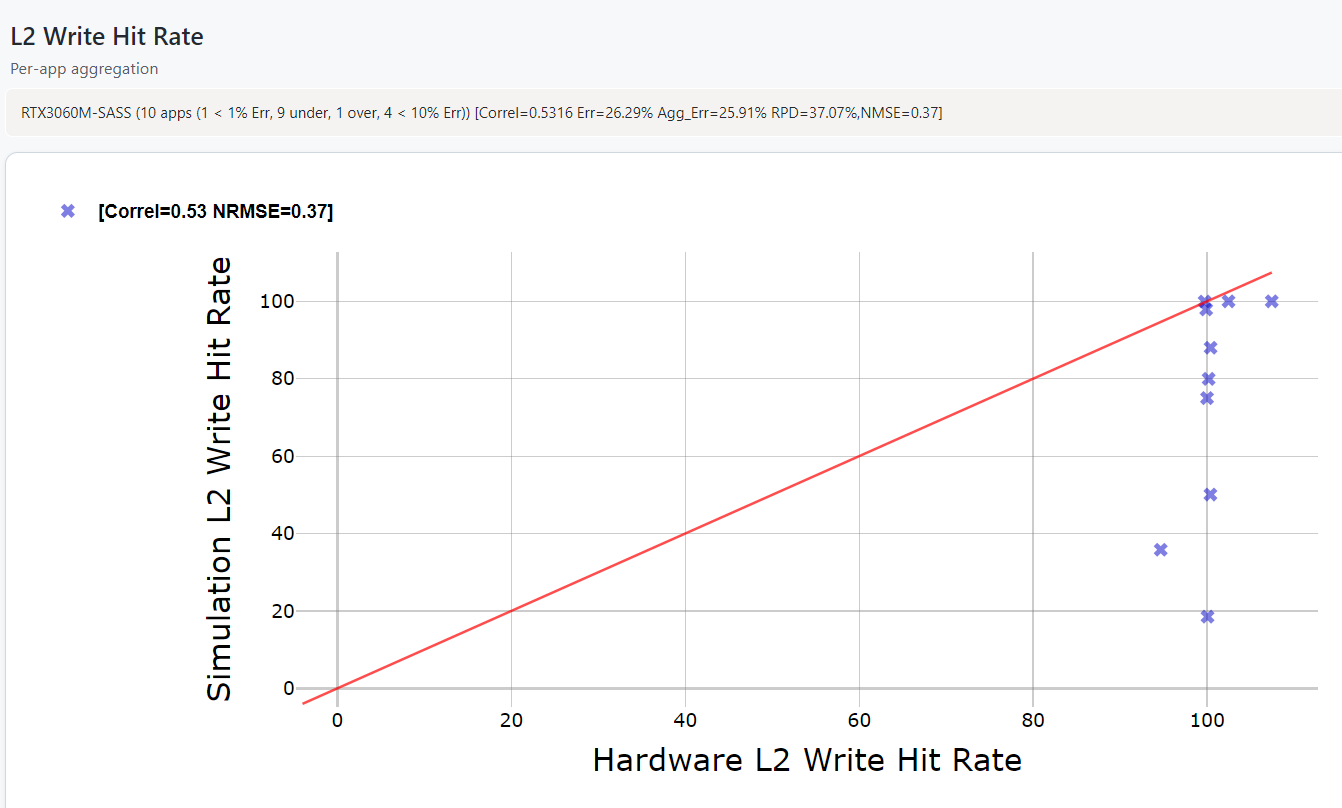
With section 3 in mind, the pattern makes sense. A write to a sector the L2 already has is a HIT on both sides. A write to a line the L2 has never seen goes through wr_miss_wa_lazy_fetch_on_read and comes back as MISS. A streaming write is 100% the second kind.
5. WRITE_ALLOCATED
After some testing, I came to the conclusion that a write to a never-read line is a MISS in wr_miss_wa_lazy_fetch_on_read, but the line is allocated. In this case, NVIDIA counts it as a HIT (totally assumed here).
It kinda makes sense from the L2’s point of view tho. The write came in, the L2 took the data, and nothing had to go to DRAM. NVIDIA’s L2 hit rate can even go over 100% [5] sometimes, which already tells you its “hit” isn’t the textbook one.
So the fix doesn’t change what the cache does. It just counts these writes in a new bucket:
gpu-cache.h: a newcache_request_status::WRITE_ALLOCATED. Stats-only, never returned fromaccess().gpu-cache.cc: increment it inprocess_tag_probewhen a write miss allocates under a write-allocate policy, and leave it out ofTOTAL_ACCESS.
access_status = (this->*m_wr_miss)(addr, cache_index, mf, time, events, probe_status);
if (m_config.m_write_alloc_policy != NO_WRITE_ALLOCATE &&
    access_status == MISS) {
  m_stats.inc_stats(mf->get_access_type(), WRITE_ALLOCATED, mf->get_streamID());
  m_stats.inc_stats_pw(mf->get_access_type(), WRITE_ALLOCATED, mf->get_streamID());
}
Why it’s written this way:
- Only on
MISS: from a write-miss handler,MISSmeans the line got allocated.RESERVATION_FAILmeans the cache couldn’t take the write this cycle, and the same request comes back next cycle, so counting it there would count it twice. - Only under write-allocate: with no-write-allocate, nothing is allocated. The counter stays 0, and
HIT + WRITE_ALLOCATEDis justHITfor those configs. - Not in
TOTAL_ACCESS: the same access is already counted asMISS(orSECTOR_MISS/HIT_RESERVED, depending on what the probe said). Adding it again would inflate the total. Same idea asMSHR_HIT, which is already left out for the same reason. - Stats-only:
HIT,MISSandTOTAL_ACCESSstay byte-identical to a build without it, and timing doesn’t change at all.4 It’s fully additive, so it can’t break anyone else’s numbers.
On the correlation side, “L2 write hits” becomes HIT + WRITE_ALLOCATED. The result on the same 10 Rodinia apps:
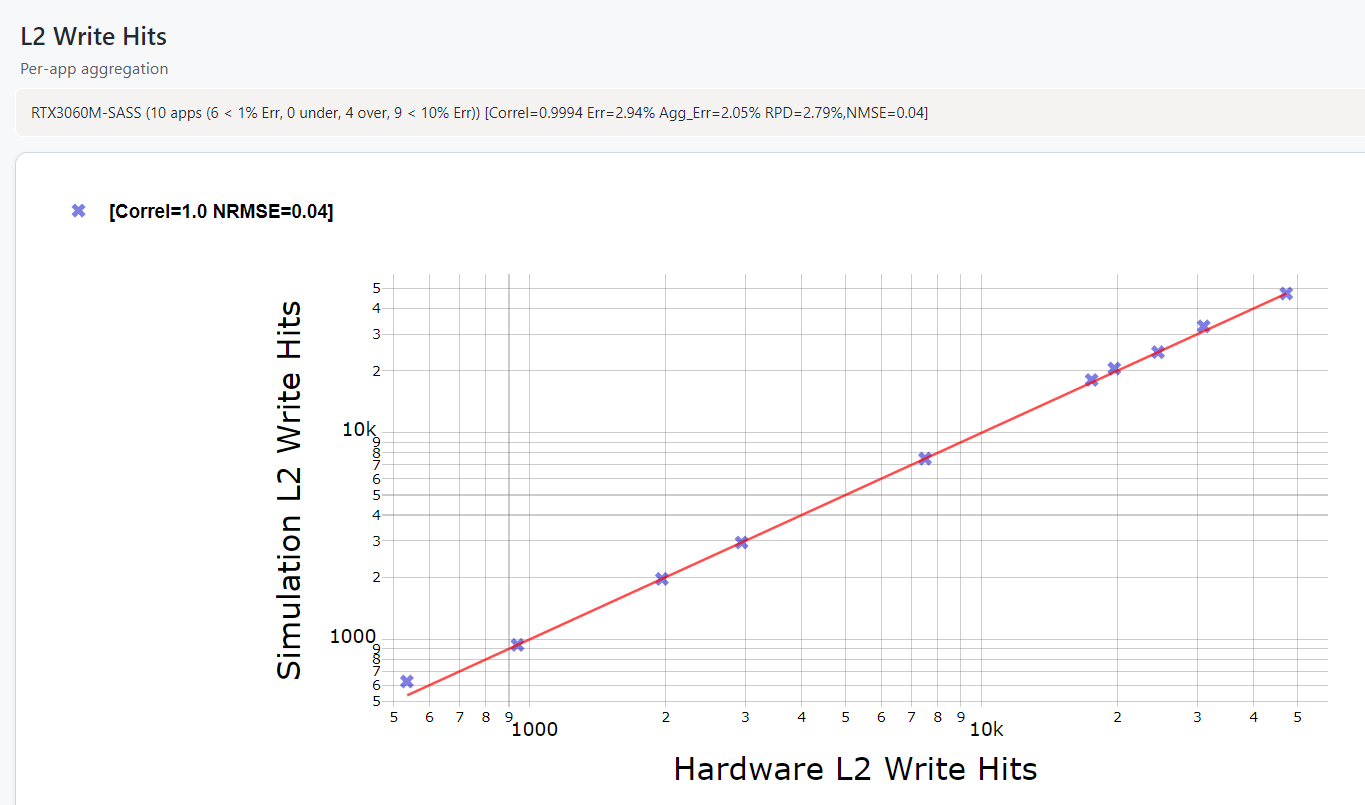
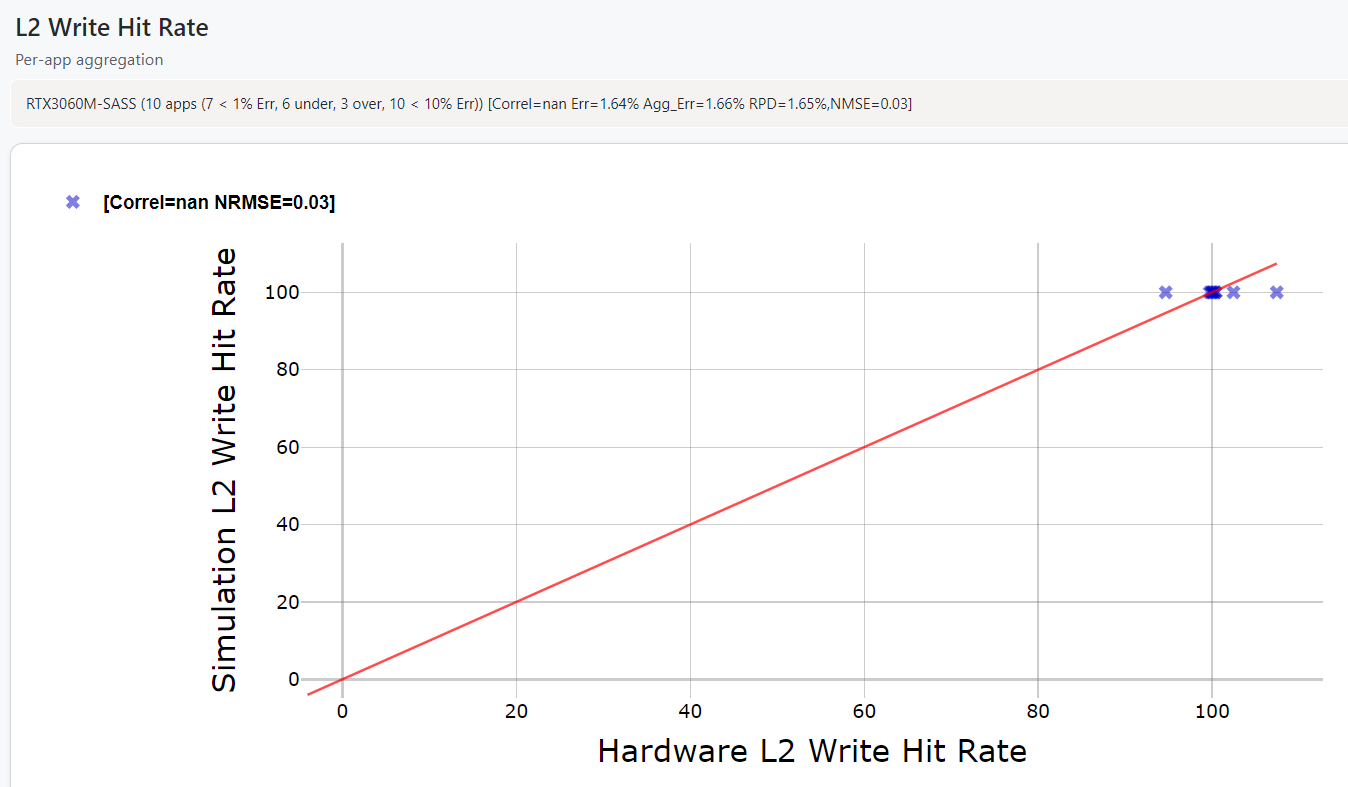
JRPan approved it, asked me to run the formatter (mb), and it got merged into dev on Aug 12, 2026.
- I also checked the other places that add up cache stats, like
get_sub_statsand the power model’sget_sub_stats_pw. They only pick the statuses they name (HIT,MISS,SECTOR_MISS, …), so they ignoreWRITE_ALLOCATEDtoo. ↩
6. Local Memory
Rodinia looked great, so I ran ISPASS-2009 next. 4 of 6 apps looked reasonable, with 2 hard outliers:
| app | hardware write hits | sim HIT + WRITE_ALLOCATED | ratio |
|---|---|---|---|
| LPS | 130,000 | 130,000 | 1.00 |
| NN | 13,039 | 13,111 | 1.01 |
| BFS | 334,987 | 346,768 | 1.04 |
| NQU | 234 | 256 | 1.09 |
| RAY | 276,064 | 16,384 | 0.06 |
| STO | 7,856 | 24,576 | 3.13 |
LPS is a pure streaming write: the strict HIT was 0, and the new counter fixes it completely. However, RAY is 17× under and STO is 3× over. My plan was to check what other stats RAY and STO might be reading (that the other apps don’t have, of course). Another counter?
My theory was correct. It was another counter, a LOCAL_ACC one.
Local memory is per-thread memory that actually lives in DRAM, which happens in register spills, and arrays the compiler can’t keep in registers. It goes through L1 and L2 just like global memory, but GPGPU-Sim counts it under its own access type, LOCAL_ACC_W. NVIDIA’s lts__ counters are all-source: they count every L1 → L2 write regardless of address space, while the sim side only read GLOBAL_ACC_W. So I needed to add LOCAL_ACC_W from the L2 stats too.
One catch: for LOCAL_ACC, I can’t just read TOTAL_ACCESS like for GLOBAL_ACC. I have to read the individual buckets (HIT, MISS, SECTOR_MISS) and add them together, because gpu-cache.cc only prints TOTAL_ACCESS when it’s non-zero:
for (unsigned type = 0; type < NUM_MEM_ACCESS_TYPE; ++type) {
  if (total_access[type] > 0)
    fprintf(fout, "\t%s[%s][%s] = %u\n", m_cache_name.c_str(),
            mem_access_type_str((enum mem_access_type)type), "TOTAL_ACCESS",
            total_access[type]);
}
So any app without local traffic has no LOCAL_ACC_W line at all, and the correlation script drops it. I found this by comparing the run files of RAY (which has local traffic) and BFS (same suite, no local traffic):
# RAY
Total_core_cache_stats_breakdown[GLOBAL_ACC_R][TOTAL_ACCESS] = 8192
Total_core_cache_stats_breakdown[LOCAL_ACC_R][TOTAL_ACCESS] = 62960
Total_core_cache_stats_breakdown[GLOBAL_ACC_W][TOTAL_ACCESS] = 16384
Total_core_cache_stats_breakdown[LOCAL_ACC_W][TOTAL_ACCESS] = 263532

# BFS
Total_core_cache_stats_breakdown[GLOBAL_ACC_R][TOTAL_ACCESS] = 180
Total_core_cache_stats_breakdown[GLOBAL_ACC_W][TOTAL_ACCESS] = 21
# no [LOCAL_ACC_W][TOTAL_ACCESS] line at all
RAY writes 16 times more to local memory than to global memory. When we add GLOBAL_ACC_W and LOCAL_ACC_W together, RAY becomes near identical between sim and hardware.
I re-ran rodinia_2.0-ft first to make sure it doesn’t mess anything up, and as expected, since Rodinia has no register spilling, the graphs stay the same. And the results for ISPASS were surprising:
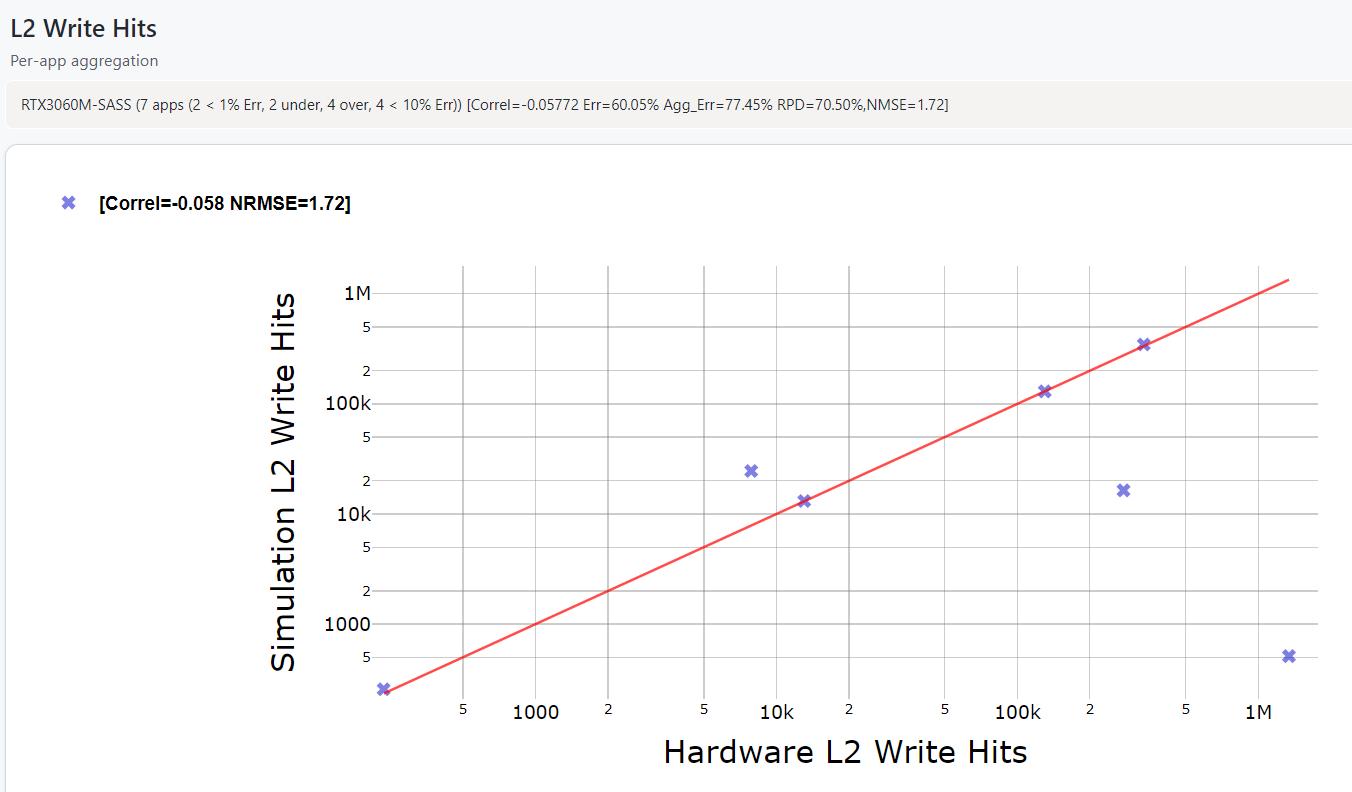
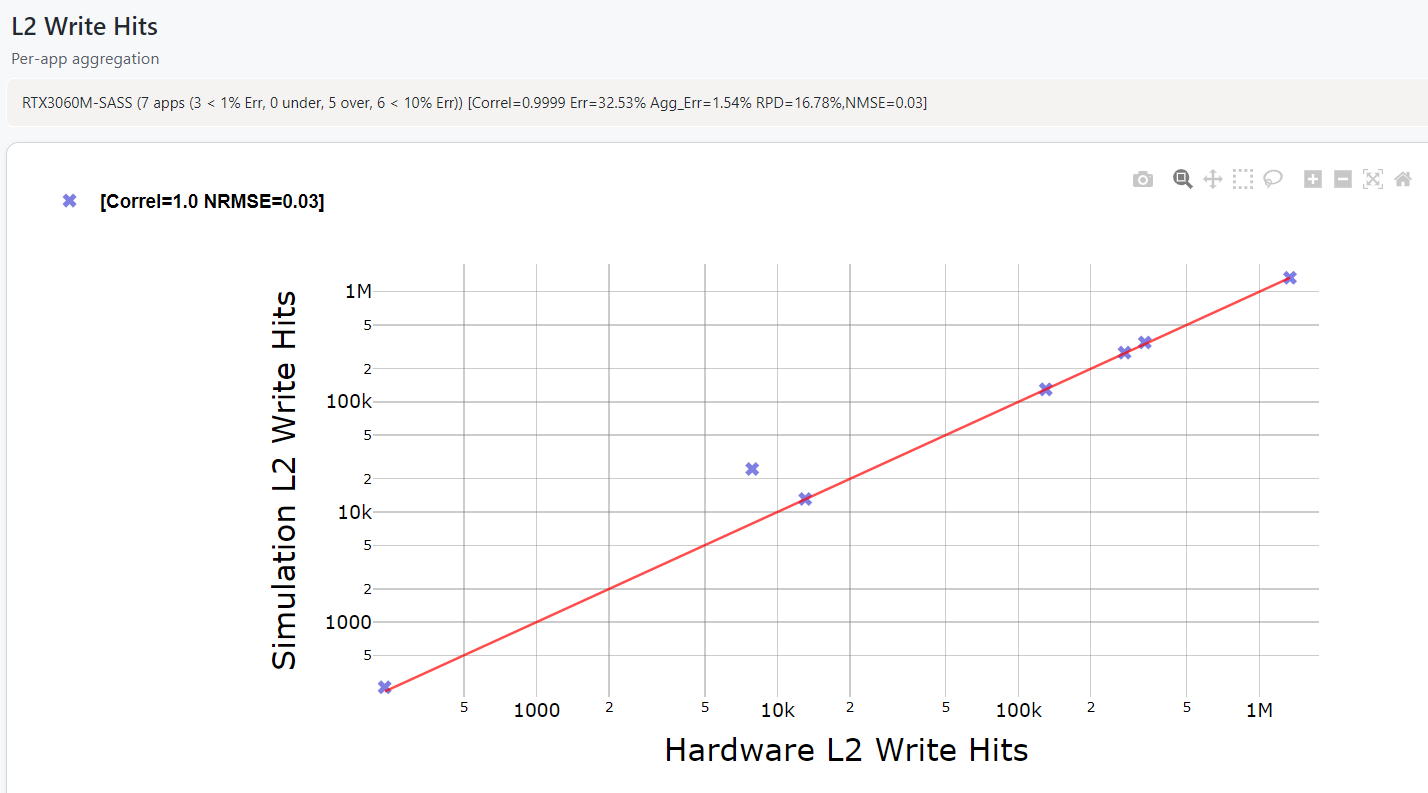
This fixed not only 1, but 2 apps: RAY, and LIB, the job I terminated early during the first run to eat lunch (so that’s why it isn’t in the table above). More than I expected.
This one is a correlation-side fix (which stats to add up), so it lives in accel-sim-framework #551, not in the simulator.
7. Something’s Wrong
That leaves STO, 3× over. STO has no local traffic, and the L1 stats between sim and hardware match perfectly, so the error has to be on the path from L1 to L2.
STO (from cust.h and sha1_kernel.cu) uses byte-granularity writes: each thread writes 4 consecutive bytes as four separate 1-byte stores. That’s 8 threads per 32 B sector, so per warp, all 4 store instructions hit the same 4 sectors. Doing the math:
| count | why | |
|---|---|---|
| output | 196,608 B | 49,152 threads × 4 B = 1,536 lines = 6,144 sectors |
L1 MISS | 1,536 | exactly one per 128 B line |
L1 SECTOR_MISS | 4,608 | the other 3 sectors of each line |
L1 HIT | 18,432 | 3 × 6,144 redundant re-touches |
| L1 total | 24,576 | 4 × 6,144, matches hardware exactly |
Since the L1 is write-through, we call send_write_request() on every one of those, so the sim’s L2 also sees 24,576 writes. The real L2 sees 7,856. That’s where it gets messy, because on ISPASS BFS, the L1 and L2 write totals are the same (346,688 in the sim), and that matches hardware for both L1 and L2. Why does the hardware act write-through on BFS but not on STO?
To compare apps, let’s define HWKeep, the share of L1 store sectors that actually reach L2 on real hardware:
HWKeep = lts__l1tex__
The top is every write sector the L2 receives from the L1, whatever the address space. The bottom is every global store sector the L1 handled. Both count 32 B sectors, so they compare directly. On an app that only does global stores:
HWKeep= 1: every store got forwarded to L2 on its own, which is what write-through should do.HWKeep< 1: fewer writes reached L2 than the L1 handled, so something in between combined them.HWKeep> 1 shouldn’t happen, since there would be more L2 writes than stores to explain them.
The “only global stores” part matters. Local writes (register spills) show up on the top but not on the bottom, so on an app like RAY, HWKeep goes up for reasons that have nothing to do with merging.5
Since the policy is write-through, HWKeep should be about 1.000. It isn’t for some apps, especially STO and l1_lat (from GPU_Microbenchmark, single-threaded, measures L1 hit latency), where HWKeep is as low as 0.251. On those, the sim over-counts L2 writes.
At first, I hypothesized that it had to do with the write policy, like the L1 being write-back. But that didn’t seem to be the answer. backprop rules out a write-back L1: 92.8% of its store sectors hit in L1, and it still forwards 94.7% of them to L2. (This argument doesn’t actually hold up, see the update.)
A better explanation: there’s a merger somewhere on the L1 → L2 path, where consecutive writes to the same sector get combined. To test this on real hardware, I wrote a new microbenchmark with two loop nestings:
- Fill-then-move: fill a sector before moving on to the next one. Merging should kick in.
- Sweep-then-revisit: write one slot in every sector, then come back for the next slot.
The result: same 75% L1 hit rate, but 4× different L2 write traffic (HWKeep = 0.25 for the first loop, 1.00 for the second). Something is def merging.
- In the sim’s L1 stats from section 6, RAY has 16,384 global write accesses and 263,532 local ones. If the real GPU looks anything like that, RAY’s
HWKeepwould come out around 17, even with nothing merging at all. STO andl1_lathave no local traffic, so the values in this section are fine. Adding local stores to the bottom (l1tex__t_sectors_pipe_lsu_mem_local_op_st) would make the ratio work for apps like RAY too. ↩
8. Merge Buffer
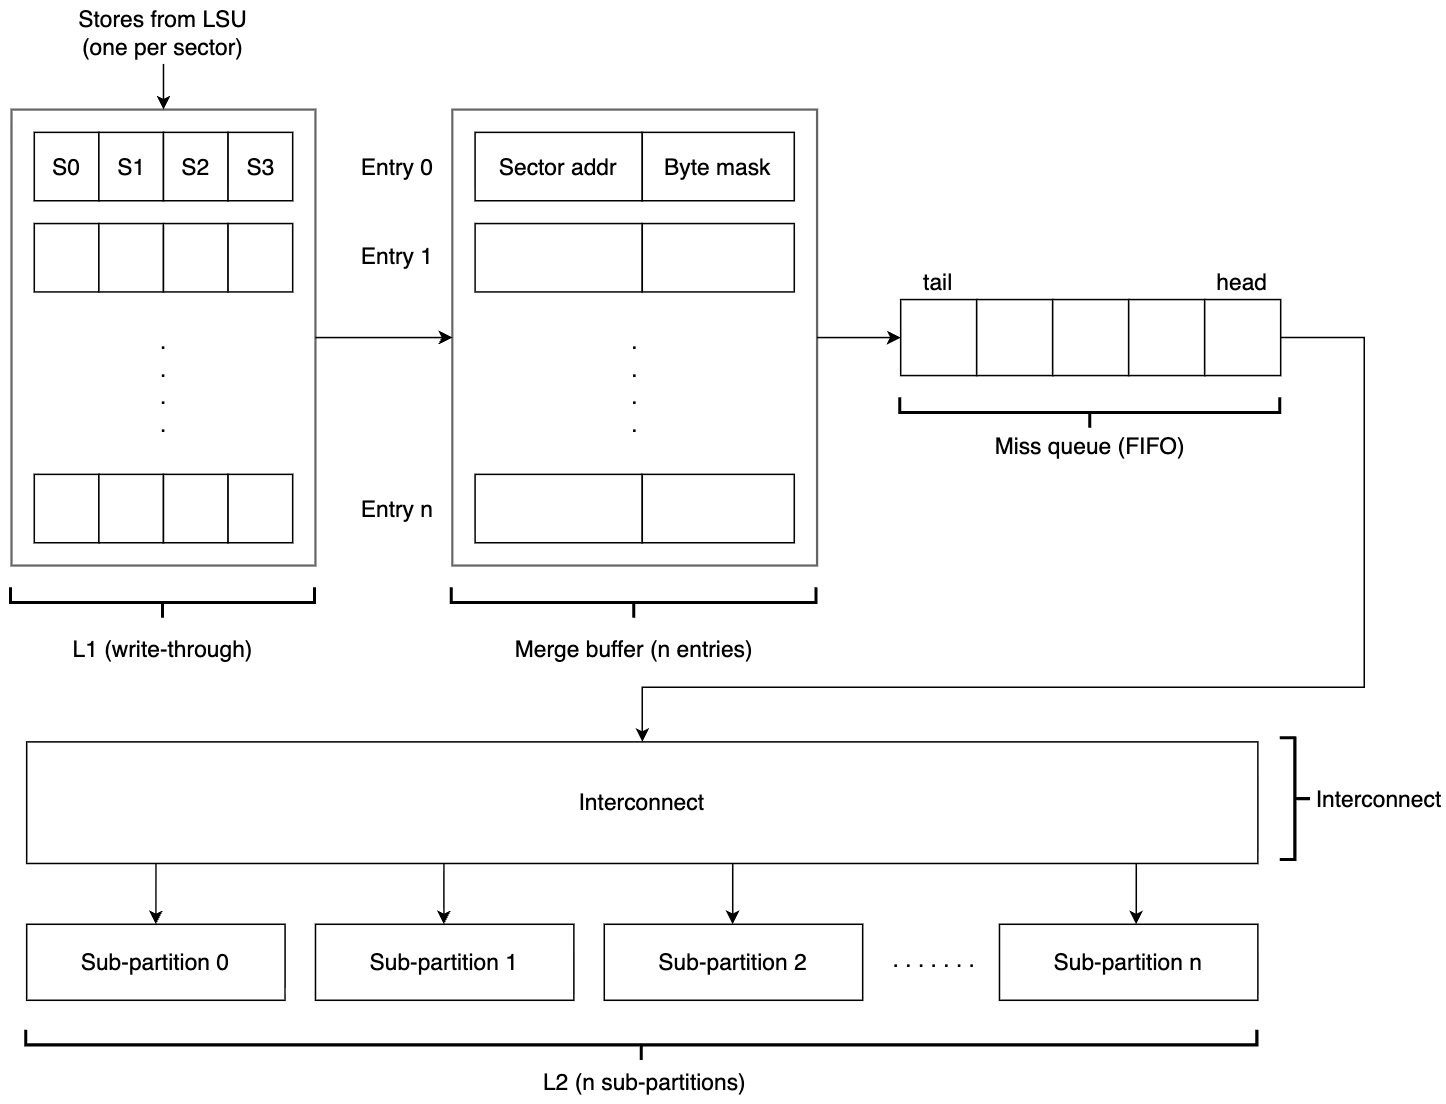
So I added a merge buffer to the L1 → L2 path: L1 → buffer → FIFO (the miss queue from section 2) → L2. The buffer has n entries, and a request only goes out when its entry gets evicted. For example:
Request 0 -> sector 0      -> stored in entry 0
Request 1 -> sector 0      -> merged with request 0
Request 2 -> sector != 0   -> a separate entry
...
Request n -> sector m      -> pushes entry 0 out of the table
                           -> it goes down to the FIFO, then out to L2
In the actual prototype, I cheated a bit: the first request to sector 0 goes to the FIFO right away, and later requests to that same sector get dropped while it’s still in the table. It’s the same count, easier to implement, and correct for L2 write sectors (not functionally correct though).
“Why not merge in the FIFO itself?” That was the question I initially had. The problem is l1_lat: it’s single-threaded, so any request in the FIFO gets drained almost straight away, and there’s nothing to merge with. But the hardware run shows that merging happens on l1_lat. So the merging has to happen in something that holds on to writes longer than the FIFO.
To my surprise, the merger actually fixed most of the issue. Across 32 apps (ISPASS-2009, Rodinia 2.0-ft, GPU_Microbenchmark), with a 4-entry buffer:
| L2 write hits | before | after (4 entries) |
|---|---|---|
| mean error, 32 apps | 19.10% | 2.33% |
l1_lat | +299% | −0.1% |
| STO | +221% | −18.0% |
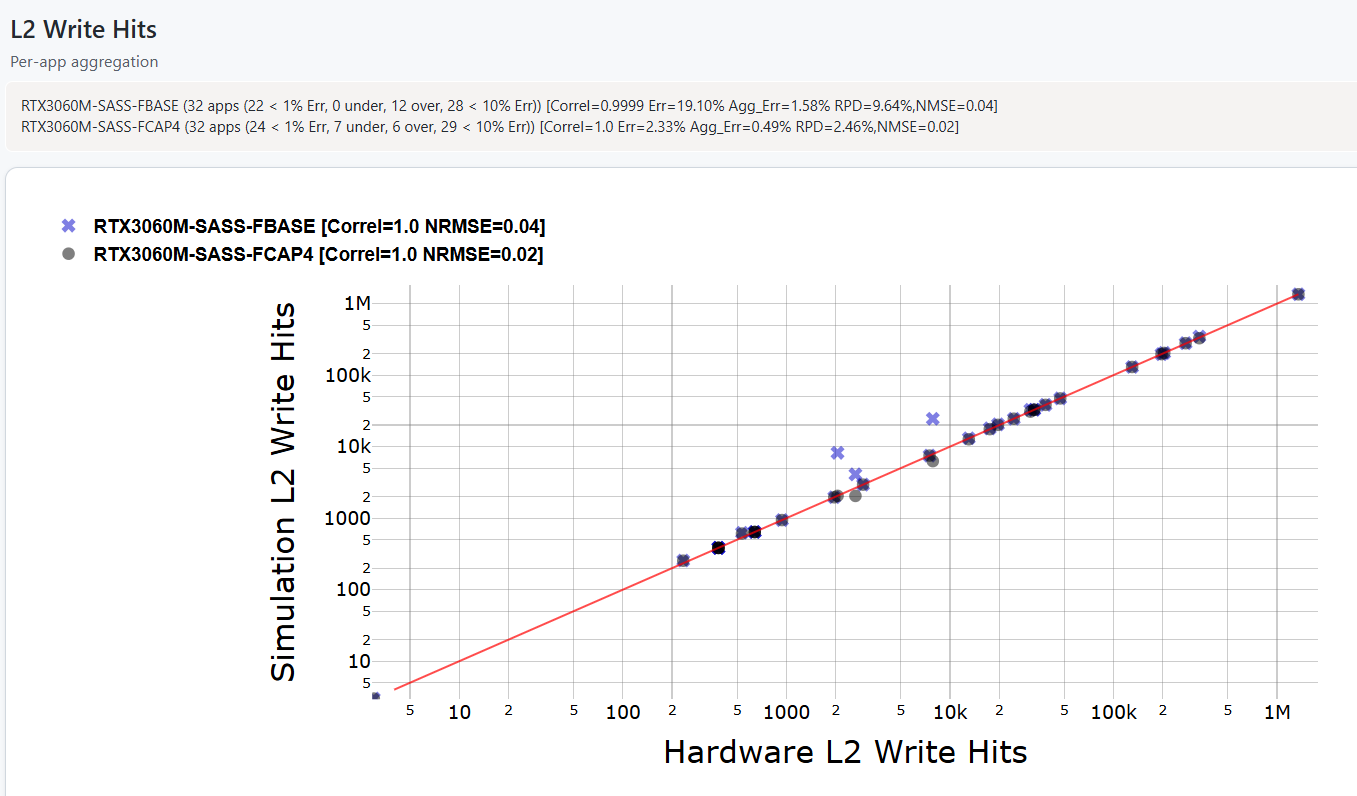
19 apps stayed bit-identical, and the worst collateral change anywhere was hotspot at −0.2%. So nothing regressed.
9. Something’s Still Wrong
However, the microbenchmark refuses to fit, and that’s a big issue.
In the microbenchmark, each thread fills a 32 B sector with four 8 B stores, across CHUNKS sectors, in the two loop orders from before:
- fill-then-move:
for c { for k }. Finish a sector, then move to the next (row-major). - sweep-then-revisit:
for k { for c }. Write slot 0 of every sector, then slot 1, … (column-major).
At CHUNKS = 1 there’s only one row. Both orders write the same four cells of that one row, in the same address sequence. The only difference is that the compiler unrolls one into back-to-back stores and leaves loop-control instructions between the other’s. The hardware still gives 0.250 vs. 1.000 on that pair.
So no buffer keyed on sector addresses can reproduce both. It sees an identical address stream and must return the same answer. Measured, running the microbenchmark through the simulator:
ordering (CHUNKS = 1) | hardware | 4 entries | 32 entries | 112 entries |
|---|---|---|---|---|
| fill-then-move | 0.250 | 1.000 | 0.250 | 0.250 |
| sweep-then-revisit | 1.000 | 1.000 | 0.250 | 0.250 |
Welp. The results make sense on the apps, but don’t make sense on the microbenchmark. At CHUNKS = 1 both loops look the same to the buffer, so it must give the same answer. The hardware didn’t, so its decision must’ve depended on something that isn’t in the address stream.
You know what? L2 counters might be busted 🥀😭. It doesn’t help that the Accel-Sim 2.0 paper [6] only shows L2 accesses and misses, with reads and writes lumped together. Write hits never get checked on their own, so the problem isn’t addressed there. I think the hardware distinguishes two instruction streams that differ only by loop-control instructions between the same stores. The cache can’t observe that, so this likely belongs in the LSU or the access-generation path, not in wr_hit_wt.
Timing didn’t help either. The day before, JRPan (one of the maintainers) told me that if I wanted this merged, I had to finish it that week, because a new release was coming and the memory subsystem would change a lot in it. My reply:

I do think there’s a solution to this. But between the architectural changes I’d have to make, the time constraint, and the memory subsystem changing drastically in the new release, I stopped there with the merge buffer. The WRITE_ALLOCATED counter went in on its own.
10. Concerns
- THIS IS TOTALLY AN ASSUMPTION based on my own observation. NVIDIA doesn’t document what counts as an L2 write “hit”.
HIT + WRITE_ALLOCATEDis an estimate that matches on two suites, not an exact reproduction of NVIDIA’s definition. - One GPU. Everything here is an RTX 3060 Laptop. JRPan pointed out that RTX Ampere doesn’t have a partitioned L2 (I checked, there is none lol). That’s a different thing from the sub-partitions in section 2: on A100 and H100, the whole L2 is split into two halves with a fabric between them, and traffic crossing it shows up in the
ltcfabriccounters. The 3060’s L2 is one piece, so there’s no cross-partition traffic in any of these numbers. On Hopper and Blackwell, that traffic matters a lot more, so the counters might behave differently there. - STO is still off. Without the merge buffer, the merged version still over-counts STO’s L2 writes by about 3× (the last post shows the same thing).
- L2 reads and DRAM reads look extremely ugly in these tests too (not caused by my counter, of course). I still haven’t looked into those.
- Only the counter is merged. The correlation mapping that uses it (L2 write hits =
HIT + WRITE_ALLOCATED) is still open in #551, so stock Accel-Sim still compares plainHIT. More in the H100 post. - Old numbers. Every number here is from July, on Accel-Sim 1.x. I didn’t rerun anything on 2.0.
11. So What?
The fix itself is tiny: one new enum value, one if, and one condition to keep it out of TOTAL_ACCESS. Most of the time went into figuring out what NVIDIA means by a “hit”, because the sim wasn’t doing anything wrong. It just counted the same event under a different name. Same with LOCAL_ACC_W. The sim modeled the writes fine, the correlation was just reading the wrong stats. Before blaming the model, check that both sides are counting the same thing.
The merge buffer taught me something else: matching the apps doesn’t mean the model is right. It brought the mean error on 32 apps down to 2.33% and still turned out to be wrong, and I only know that because of a microbenchmark built to break it. Without that, I probably would’ve shipped it.
Next, I want to look at STO and l1_lat again on Accel-Sim 2.0’s new memory subsystem, this time in the LSU and access-generation path, and finally figure out why L2 read hits and DRAM reads don’t line up.
See you in the next one!
Update: My Big Mistake
On Oct. 31, I had to take out my old laptop again (yes, that one) to run some experiments on Accel-Sim.
And then it hit me.
Firstly, I should’ve gone out partying on Halloween. Secondly, this whole post assumes the 3060’s L1 is write-through with lazy fetch on read (L:T:m:L:L), because that’s what the config says. What if it doesn’t?
That matters because, with a write-through L1, the four policies from section 3 send different traffic to L2 in the sim. Take one sector that gets 4 stores in a row:
| policy | 1st store | next 3 stores | L2 writes | L2 reads |
|---|---|---|---|---|
N | forwarded, not allocated | miss again, forwarded | 4 | 0 |
W | forwarded, allocated, sector fetched | hit, forwarded | 4 | yes |
L | forwarded, allocated, nothing fetched | hit, forwarded | 4 | 0 |
F | allocated and kept in L1, not forwarded | hit, forwarded | 3 | on partial writes |
With N, W or L, every store reaches L2, so the STO over-count from section 7 looks the same whichever one the hardware uses. F is the odd one out. In GPGPU-Sim, with a write-through L1, it never forwards the first store of each sector, and it skips the writeback when the line gets evicted, so that data never reaches L2 at all. That’s a simulator bug for the T + F combo, but my config doesn’t use it.
The merge buffer cares too. It only hooks the write-hit path and the lazy-fetch miss path, so its results only mean something if the real L1 is L.
So I tested it with the same microbenchmark from section 7, on the real 3060 Laptop (CUDA 12.8, ncu --clock-control=base), one pass over 79 kernels. All of them only store, no loads. So if the L1 fetches on a write miss, those fetches are the only thing that can show up as L2 reads coming from the L1 (lts__t_sectors_srcunit_tex_op_read).
| total over 79 kernels | count |
|---|---|
| L1 store sectors | 2,941,540 |
| L1 store misses | 1,458,640 |
| L1 load sectors | 0 |
| L2 reads from L1 | 0 |
| DRAM reads | 13,516 |
| L2 writes | 2,057,072 |
| L2 write hits | 2,052,944 (99.8%) |
Three kernels tell most of the story:
| kernel | L1 store hit rate | L2 writes ÷ L1 store sectors | L2 write hit rate |
|---|---|---|---|
36: fill-then-move, CHUNKS = 1 | 75% | 0.250 | 100% |
46: sweep-then-revisit, CHUNKS = 1 | 75% | 1.000 | 100% |
| 17: 4 MB footprint, bigger than the 3 MB L2 | 0% | 1.000 | 100% |
(Kernels 36 and 46 are the same pair as the hardware column in section 9. The full per-kernel numbers are in this CSV.)
Here’s what that says.
- No fetch on a write miss. 1.46 M store misses, and zero L2 reads. W and F both fetch, so they’re out.
- The L1 allocates on a write miss. Writing the same sector 4 times gives a 75% store hit rate (1 miss, then 3 hits). A no-write-allocate L1 can never hit on store-only code, so N is out.
- That leaves L. The config was right, and the merge buffer was modeling the right policy.
- The L2 doesn’t fetch on writes either. DRAM reads stay at about 100–200 per kernel (two outliers at 448 and 1,112), even on kernel 17 with 131 K store misses. That matches the L2 config,
L:B:m:L:P.
There’s a bonus too. 99.8% of all L2 writes count as hits. That includes kernel 17, whose 4 MB footprint is bigger than the 3 MB L2, so most of those sectors can’t already be sitting in it. NVIDIA really does count a write that allocates without fetching as a hit, which is exactly what WRITE_ALLOCATED was guessing back in July. So the “totally assumed” in section 5 is a lot less assumed now.
It also caught a mistake in section 7. I said backprop rules out a write-back L1, since 92.8% of its store sectors hit in L1 and it still forwards 94.7% of them to L2. That doesn’t actually prove anything. backprop’s store hits most likely come from its own earlier loads (it reads its weights, then writes them), and a write-back L1 would also forward each dirty sector about once.
The real proof is kernel 46. It rewrites each sector that’s already in the L1 4 times (75% store hits), and the hardware forwards all 4 writes. A write-back L1 would forward about one.
And that’s my BIGGEST mistake. I built a whole merge buffer on top of a config value I never checked. It turned out to be right, but that was luck, not process. If the 3060 had used F, the merge buffer would’ve been modeling the wrong policy and its 32-app result would’ve meant nothing. Next time, I test the assumption first, before committing to one direction.
A few caveats.
- This assumes ncu flushes the caches before each kernel (its default,
--cache-control all). I didn’t check what July’s runs used. - This shows “allocate, no fetch on write”. It doesn’t test the other half of lazy fetch (fetching when a partly written sector gets read), but the write story doesn’t depend on it.
- The microbenchmark never spills, so local memory doesn’t sneak into the L2 write counter (the problem from footnote 5).
References
- Accel-Sim, “Accel-Sim framework,” GitHub. [Online]. Available: https://github.com/accel-sim/accel-sim-framework
- S. Che et al., “Rodinia: A benchmark suite for heterogeneous computing,” in Proc. IEEE Int. Symp. Workload Characterization (IISWC), 2009, pp. 44–54, doi: 10.1109/IISWC.2009.5306797.
- A. Bakhoda, G. L. Yuan, W. W. L. Fung, H. Wong, and T. M. Aamodt, “Analyzing CUDA workloads using a detailed GPU simulator,” in Proc. IEEE Int. Symp. Perform. Anal. Syst. Softw. (ISPASS), 2009, pp. 163–174, doi: 10.1109/ISPASS.2009.4919648.
- N. P. Jouppi, “Cache write policies and performance,” in Proc. 20th Annu. Int. Symp. Comput. Archit. (ISCA), 1993, pp. 191–201, doi: 10.1145/165123.165154.
- “L2 hit rate more than 100%,” NVIDIA Developer Forums. [Online]. Available: https://forums.developer.nvidia.com/t/l2-hit-rate-more-than-100/244570
- J. Pan et al., “Architecting the next generation of asynchronous, distributed GPUs for the AI era,” 2026, arXiv:2608.22602.